
America's Hidden Industrial Boom?


Manufacturing construction more than doubled. LNG capacity is doubling. Grid utilities committed over $1.1 trillion. Defense spending has a permanent new floor. The question isn't whether something is happening, it's whether the cycle has legs, and who actually benefits.
01·The Verdict in Four Numbers
Something is genuinely happening
America’s industrial policy pivot since 2022 — CHIPS Act, Inflation Reduction Act, the Infrastructure bill — triggered what might be the largest peacetime manufacturing investment cycle in the country’s history. But three years in, the data is more nuanced than the headlines. The boom is real. It is also inflecting, shifting, and quietly separating winners from losers in ways that aren’t yet priced.
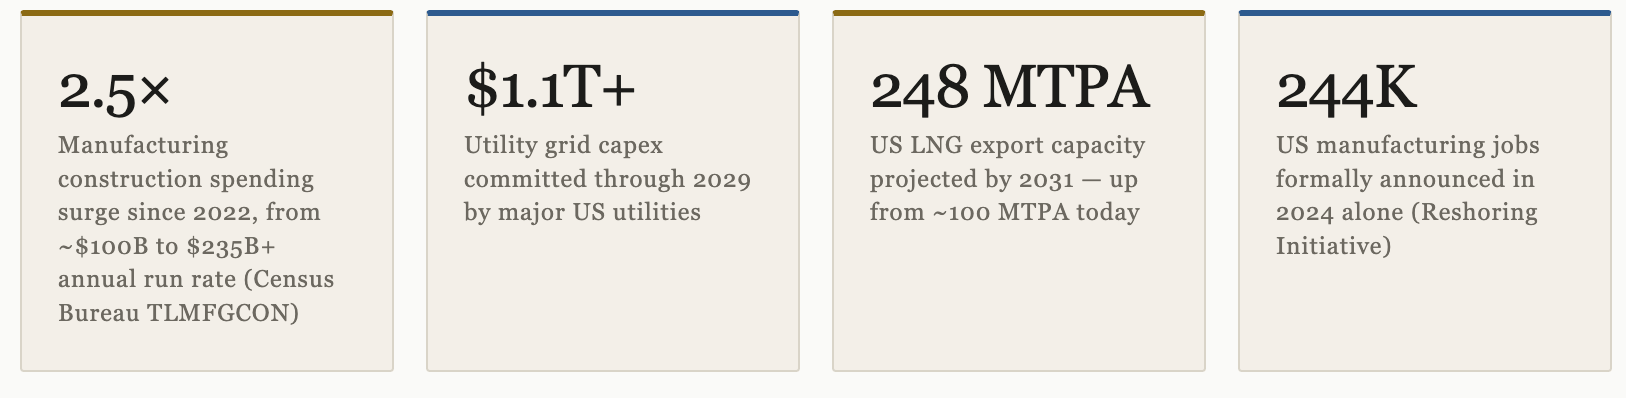
These are not projections. They are confirmed capex commitments, Census Bureau construction data, and formally announced government awards. The industrial boom is not a narrative — it is a multi-trillion-dollar reallocation of capital that shows up in permit filings, utility interconnection queues, and contractor backlogs. What requires serious analysis is whether it’s sustainable, whether it’s past peak, and which phase of the cycle we’re actually entering now.
Key Insight
The capex cycle has two distinct phases. Phase 1 — subsidized factory announcements and construction — has already peaked and is now declining from its August 2024 high. Phase 2 — grid buildout, defense procurement, factory equipment ramp, and automation — is just beginning to accelerate. The investment opportunity is shifting from announced projects to the infrastructure that actually serves them.
02·Manufacturing Reshoring
The construction boom — and its ceiling
US manufacturing construction spending, as tracked by the Census Bureau (FRED series TLMFGCON), ran at approximately $80–100 billion annually in the years before the CHIPS Act and IRA were signed in 2022. By the Q3 2024 peak, it had surged to a $235 billion annual run rate — more than doubling in under three years. To put that in historical context, there is no equivalent peacetime construction surge in the post-WWII data.
The Reshoring Initiative’s 2024 annual report documented over 244,000 manufacturing job announcements last year, with more than 1.6 million cumulative announcements since 2010. The critical caveat: announcements are not jobs. The gap between announced factory projects and actual construction starts has been consistently 30–40%, and completed, operational facilities represent a smaller share still. But the pace of actual groundbreakings has also been genuine — semiconductor fab construction, battery gigafactory shells, and EV component plants have all broken ground at a rate unprecedented in modern American industrial history.
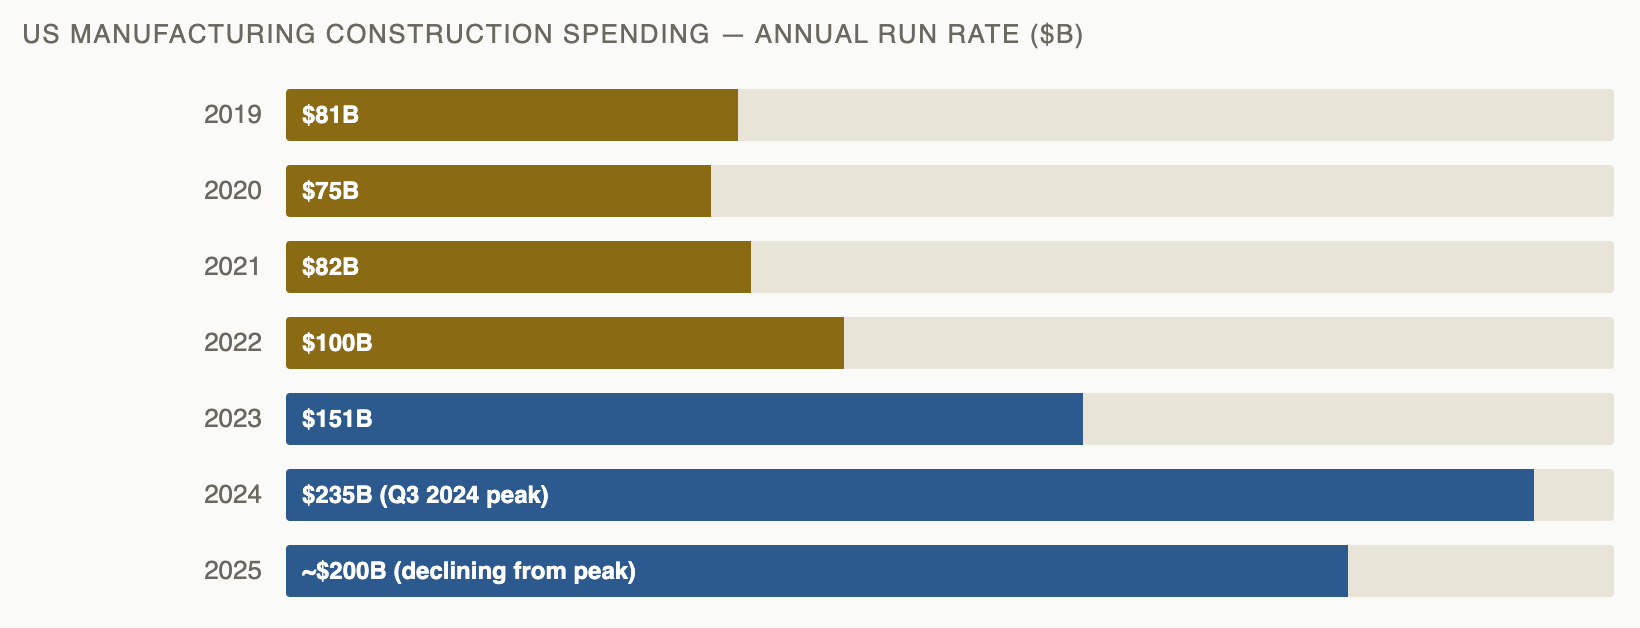
The deceleration from the Q3 2024 peak is real. Several large battery and EV plant projects have been delayed or canceled as EV demand growth missed early projections. Ford’s BlueOval City in Tennessee and GM’s joint ventures with LG Energy Solution absorbed approximately $35–40 billion in combined EV-related losses and write-downs through 2024–25. The IRA’s EV tax credits were terminated under the One Big Beautiful Bill Act signed July 4, 2025 — eliminating a core subsidy that had backstopped the EV manufacturing buildout.
Manufacturing employment tells a more sobering story. Bureau of Labor Statistics data shows US manufacturing employment at approximately 12.6 million as of Q1 2026 — slightly below the pre-pandemic level of 12.8 million in February 2020, underscoring how capital-intensive the modern industrial build has been. The structural reality: modern semiconductor and EV battery plants are highly automated. A $20 billion chip fab employs perhaps 2,000 workers when fully operational. The jobs narrative overstates manufacturing’s labor intensity in the 2020s.
What’s Actually Built vs. Announced
As of June 2026, the most honest read: factory shells are built, equipment installation is underway at semiconductor sites, and LNG infrastructure is ahead of schedule. EV battery plants are the weakest link — multiple facilities are built but underutilized as OEM demand missed projections. The manufacturing boom built a lot of buildings. The question for the next three years is whether they fill.
03·Grid Infrastructure
$1.1 trillion and the transformer problem
If there is one vector of the industrial boom that is not decelerating, it is the electricity grid. US power demand — essentially flat for 15 years as efficiency gains offset growth — is now projected to grow at rates not seen since the 1990s. The Grid Strategies “National Load Growth Report” from November 2025 documented that utility five-year load growth forecasts increased roughly six-fold since 2021 — from under 50 GW of projected new demand to over 300 GW — driven by AI data center demand, manufacturing electrification, EV charging load, and domestic industrial expansion.
The scale of the utility commitment is striking. The largest US utilities have publicly guided to five-year capital expenditure programs totaling over $1.1 trillion in aggregate through 2029. NextEra Energy, the nation’s largest utility, guided to approximately $120 billion in company-wide capital investment through 2029. Duke Energy, Dominion, American Electric Power, and Southern Company have each announced programs in the $35–60 billion range. Industry analysts estimate the total transmission and distribution investment needed through 2030 at over $700 billion — just for the wires, not including generation.
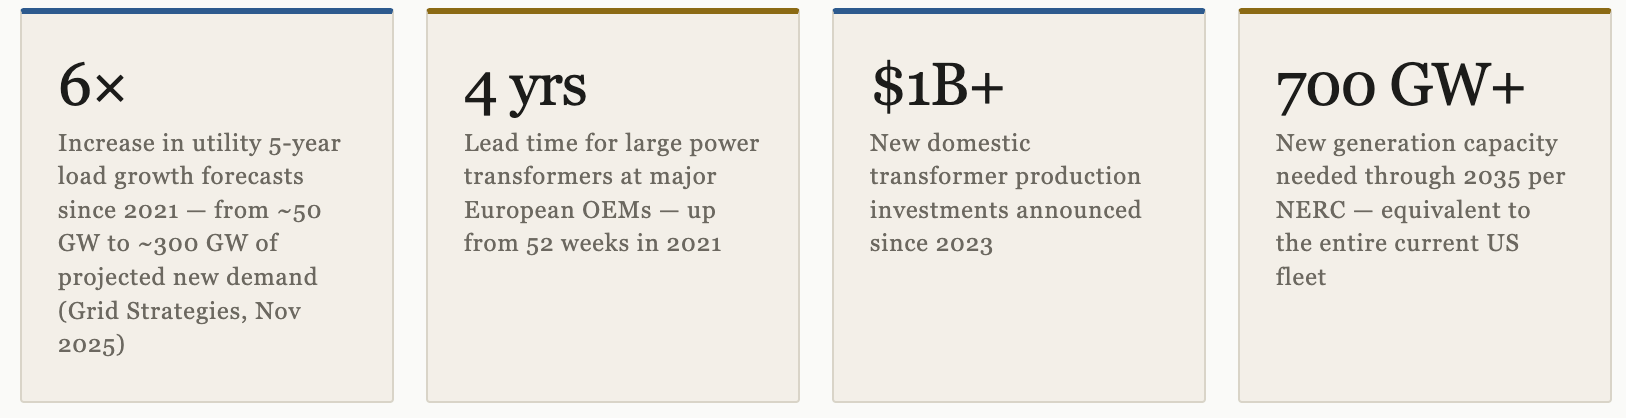
The most acute bottleneck is the one nobody saw coming: power transformers. Large power transformers — the 100+ MVA units that form the backbone of transmission infrastructure — have lead times that have extended to 44–56 months at major OEMs (ABB, Hitachi Energy, Siemens Energy). The domestic manufacturing base was hollowed out over decades; the US now imports approximately 80% of its large power transformers. Winding wire shortages, steel core constraints, and a concentrated manufacturing base have made this one of the most genuine supply-demand dislocations in the industrial economy.
This bottleneck is itself creating investment opportunity. SPX Corporation’s transformer division, Prolec GE, and several smaller domestic manufacturers have announced capacity expansion. The Department of Energy’s Grid Resilience and Innovation Partnerships (GRIP) program allocated $10.5 billion in grants for domestic transformer production and grid hardening. The investment thesis here is not the utilities themselves — regulated returns limit upside — but the equipment supply chain.
04·Semiconductors
TSMC wins; Intel is the cautionary tale
The CHIPS and Science Act allocated approximately $52 billion for semiconductor manufacturing and research — $39 billion for fab construction incentives, $13 billion for R&D. As of mid-2026, over $33.7 billion in direct funding awards has been formally announced, with the remainder in advanced negotiations or preliminary commitments. The semiconductor fab buildout is the clearest success story of the industrial policy cycle — and also home to its most spectacular failure.
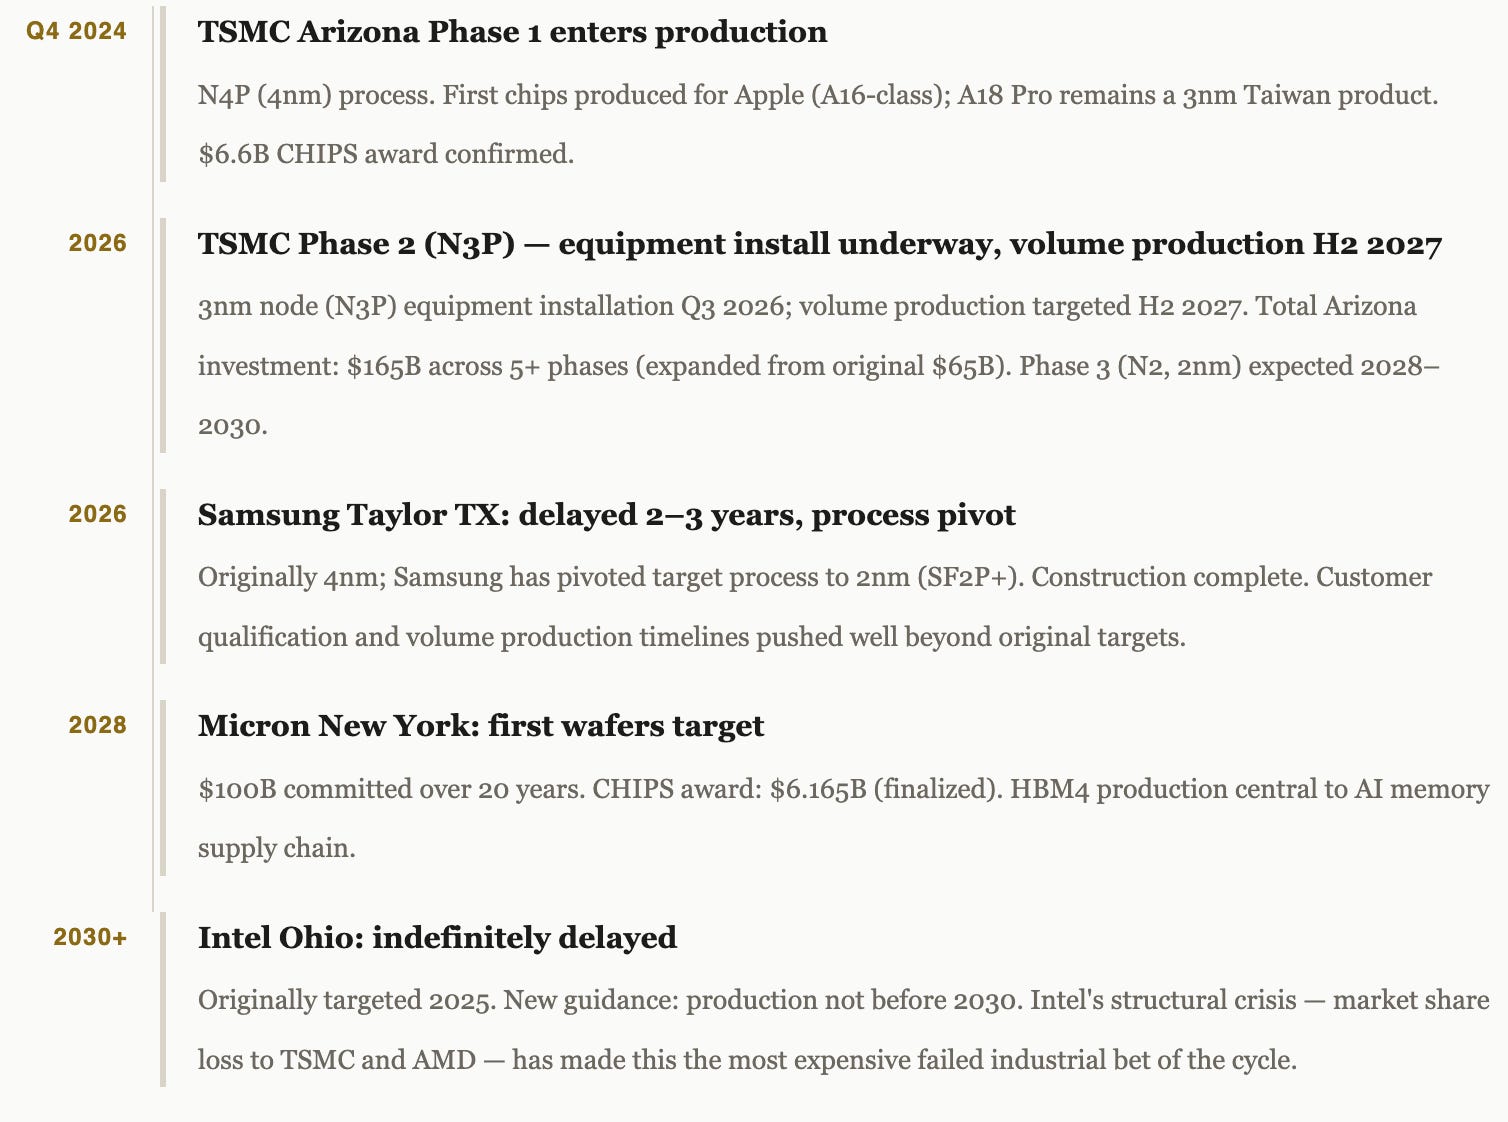
Intel’s Ohio situation deserves extended analysis because it illustrates the central risk of state-directed industrial policy: the government can subsidize a factory, but it cannot subsidize market share. Intel received $7.86 billion in CHIPS direct funding and $11 billion in loans — the largest single allocation (the preliminary $8.5B figure was later finalized at $7.86B in November 2024). But its foundry business has failed to attract meaningful external customers, its manufacturing processes have fallen behind TSMC by at least one generation, and its balance sheet has deteriorated as it simultaneously funds this buildout and absorbs operating losses. Ohio’s two-fab “Ohio One” campus is physically built. The question is whether Intel can find a path to profitability that justifies completing the ramp.
Bear Signal
Intel Ohio represents the most important bear case data point for the entire industrial policy thesis: the government can mandate construction but not competitiveness. TSMC succeeds because it has leading technology and willing customers. Intel’s CHIPS awards may ultimately result in stranded assets — world-class fabs with no viable production roadmap. The lesson for the next industrial policy cycle is sharp.
05·LNG Export Expansion
America becomes the world’s gas superpower
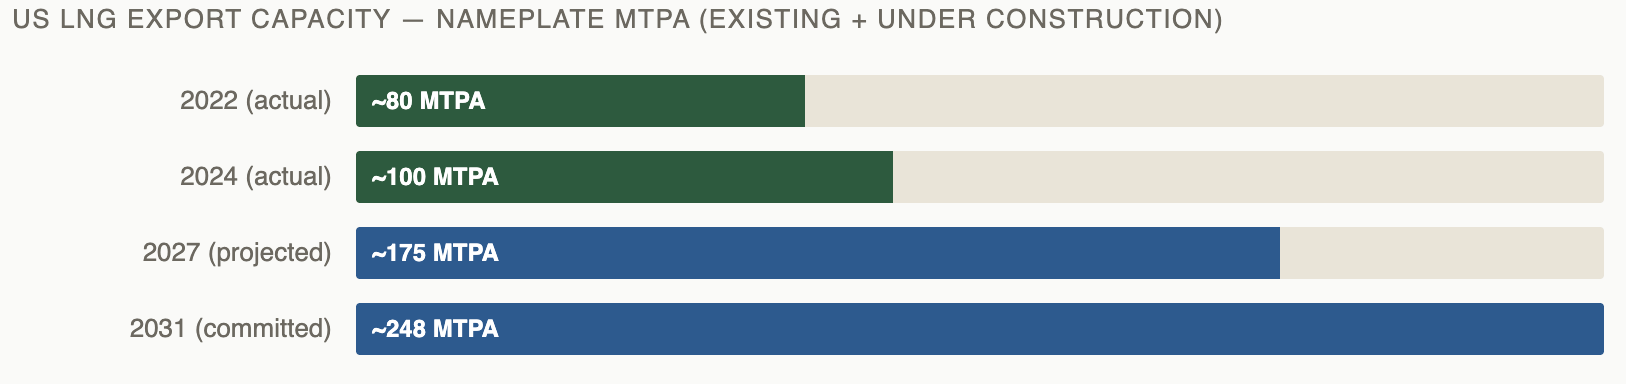
The LNG story is arguably the cleanest, most unambiguously successful leg of the American industrial buildout. The US became the world’s largest LNG exporter in 2023, surpassing Australia and Qatar. US nameplate liquefaction capacity stood at approximately 95–100 million tonnes per annum (MTPA) at the start of 2024. By 2031, committed and under-construction projects point to US capacity of approximately 248 MTPA — a 2.5× increase over seven years.
Projects currently under construction and on track for completion: Plaquemines LNG Phase 1 (13.3 MTPA, first cargo December 26, 2024, backed by Venture Global); Corpus Christi Stage 3 (~10 MTPA across seven midscale trains, Cheniere, first cargo 2025–26); Golden Pass LNG (18 MTPA, QatarEnergy/ExxonMobil, first cargo achieved April 2026 after 2024 Zachry contractor bankruptcy and restart); Port Arthur LNG Phase 1 (~13 MTPA, Sempra, FID confirmed 2023, first cargo 2027–28).
The structural driver is Europe’s accelerated LNG import buildout post-Ukraine. Germany, the Netherlands, Italy, and France have collectively added over 50 MTPA of floating storage and regasification unit (FSRU) capacity since 2022. Asian LNG demand growth — India, Southeast Asia, South Korea — provides additional demand support. US LNG benefits from basin-of-supply structural advantages: Henry Hub-linked pricing (typically $3–5/MMBtu) versus oil-linked Asian LNG spot at $12–18/MMBtu. The margin profile is structurally wide.
Investment Implication
The LNG buildout is the most durable capex story in the energy sector because it is secured by long-term purchase agreements (20-year SPAs) and supported by bilateral energy security policy rather than market prices alone. The pure-play infrastructure equity story (Cheniere, Venture Global, New Fortress Energy) is well understood; the more interesting trade may be the midstream feedgas pipeline buildout and the engineering/construction contractors that do nothing but LNG work.
06·Defense Spending
