
The American Auto Market Breaking Point
The Complete U.S. Automobile Market Report 2026


The average American now needs 46 weeks of median income to buy a new car. Auto loan rates are above 9% for the average borrower. Repossessions have surged to their highest level since the 2009 financial crisis. A new 25% import tariff just landed on every foreign-assembled vehicle. The U.S. auto market in 2026 is a study in simultaneous extremes — and understanding it requires going beyond the headline sales numbers into the financial stress underneath.
The Big Picture
Where the U.S. Auto Market Actually Stands in 2026
The U.S. auto market has spent the three years since the pandemic supply-shortage boom in a slow-motion normalization — and that normalization has exposed structural problems that the COVID-era seller’s market papered over. When inventory was scarce, any car at any price found a buyer. Dealers charged thousands over MSRP. Financing terms barely mattered because the transaction moved too fast to negotiate. That era is definitively over.
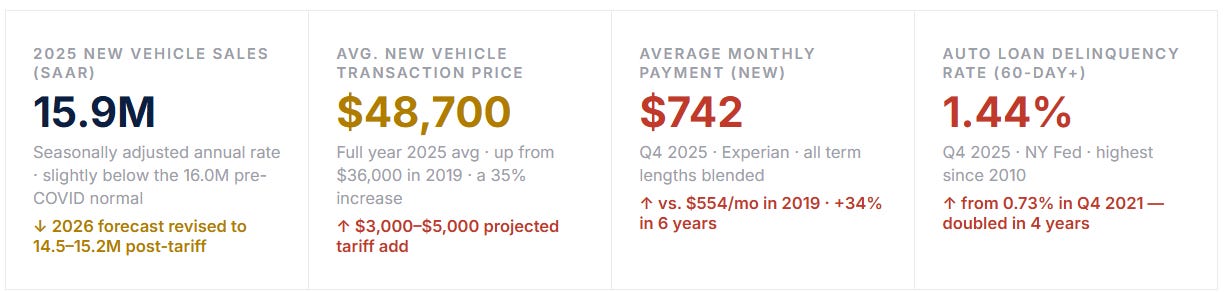
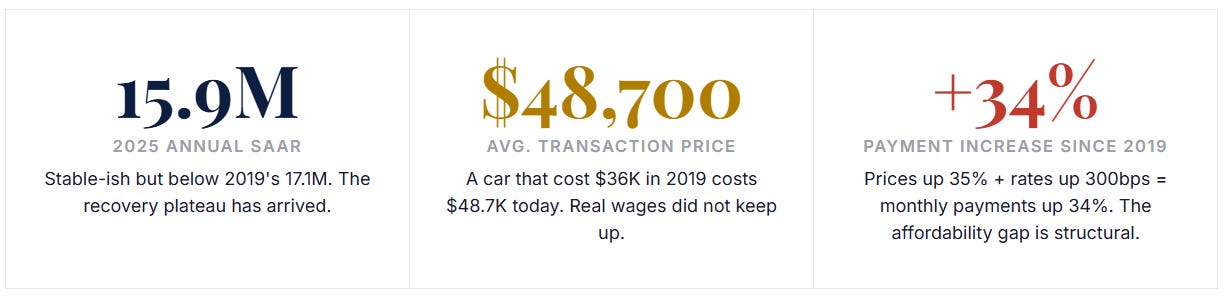
By 2025, new vehicle inventory had largely recovered to pre-pandemic levels — sitting around 2.8–3.0 million units on dealer lots nationally compared to the crisis lows of under 1 million in 2021. Days supply normalized to 65–75 days. Incentives returned. The power shifted back to buyers for the first time since 2019. Yet despite the inventory recovery and return of dealer discounts, sales never fully rebounded to the 17–18 million annual pace of the late 2010s. The reason is straightforward: the combination of higher prices, higher interest rates, and stagnant real wages made the monthly payment on a new vehicle unaffordable for a significant share of the American consumer base.
Then came 2026, and the tariff shock. In late March 2026, the Trump administration imposed a 25% tariff on all imported automobiles — including those assembled in Canada and Mexico under USMCA, and all vehicles assembled in Europe, Japan, South Korea, and elsewhere. The tariff applies to the vehicle itself, not just imported components. The immediate effect: auto stocks fell sharply, dealers rushed orders, consumers scrambled to buy before price increases, and analysts cut 2026 SAAR forecasts by 500,000–1,000,000 units. The longer-term effects will take months to fully materialize.
🚨 The 2026 Tariff Shock — Immediate Market Impact
The 25% tariff on imported vehicles that took effect in April 2026 is the most significant single regulatory event in the U.S. auto market since the 2008–2009 financial crisis. Approximately 50% of new vehicles sold in the U.S. contain significant foreign-assembled content or are fully assembled abroad. The tariff adds an estimated $3,000–$12,000 to the transaction price depending on the vehicle’s origin and content mix. Major impacted models include: virtually every Japanese and Korean brand’s U.S. lineup, BMW and Mercedes (German-assembled vehicles), and even some domestically branded vehicles assembled in Mexico (Chevrolet Silverado built in Silao, MX; Ford Maverick assembled in Hermosillo, MX). U.S.-assembled vehicles benefit competitively. The tariff is expected to compress total 2026 sales by 500K–1M units.
New Vehicle Market
New Car Sales: Volume, Mix, and the Segment Shift That Changed Everything
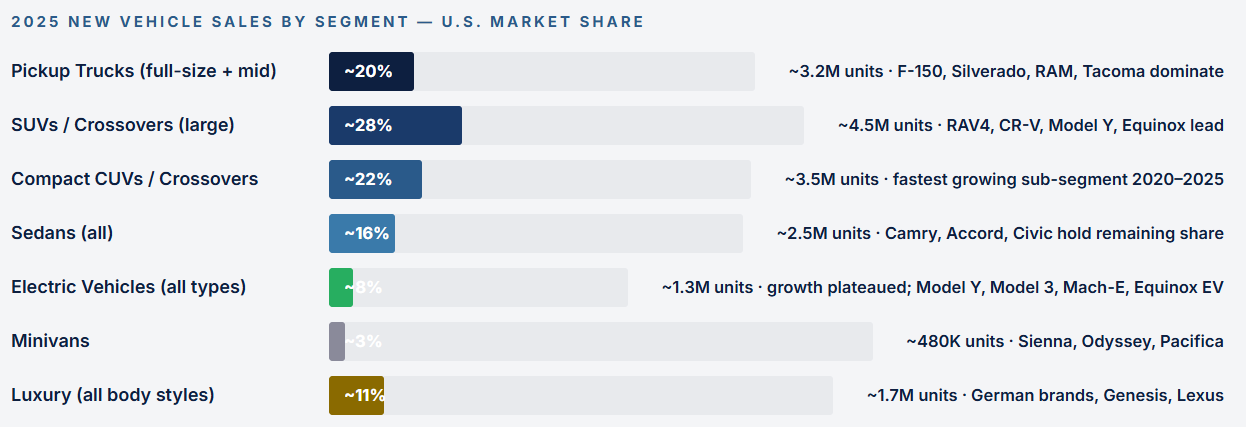
The most important structural story in new vehicle sales over the past decade is not electric vehicles, not tariffs, and not interest rates — it is the complete collapse of the traditional sedan and the dominance of the truck/SUV/crossover segment. In 2010, sedans (cars) represented roughly 50% of U.S. new vehicle sales. By 2025, that figure had fallen below 20%. The American consumer, given the choice between a car-based vehicle and a truck-based one at a similar price, overwhelmingly chooses the truck variant. This is not a media narrative — it is reflected directly in every manufacturer’s production and sales mix decisions.
The consequence is higher average transaction prices. Trucks and SUVs carry higher margins and higher MSRPs than the sedans they replaced. When Ford killed the Fusion, Focus, Taurus, and Fiesta to focus exclusively on trucks and SUVs, it was making a rational profit-maximizing decision — and every other manufacturer followed the same logic to varying degrees. The average transaction price of the vehicles Americans are now choosing is structurally higher than what they chose a decade ago, independent of inflation.
📊 The Tariff’s Asymmetric Impact by Segment
The 25% import tariff does not hit all segments equally. Full-size pickup trucks — the single highest-volume and highest-margin segment — are almost exclusively assembled in the United States and Mexico. U.S.-assembled F-150 (Dearborn, MI and Kansas City, MO) benefits competitively versus imported rivals. However, the Ford Maverick (Mexico), Chevy Silverado (some Mexico production), and RAM 1500 Classic (Mexico) face tariff exposure. The compact crossover segment — RAV4, CR-V, Rogue — has significant Japan and Canada assembly and faces the steepest tariff-driven price pressure. Toyota’s RAV4, the best-selling non-pickup vehicle in the U.S., is assembled in Georgetown KY and in Japan; the Japan-sourced units face full tariff. The effective blended tariff impact per model varies from ~$1,200 for vehicles with U.S.-heavy assembly to ~$8,000+ for fully foreign-assembled vehicles.
The Financing Story
Auto Loan Rates, Terms, and the Monthly Payment Crisis
Auto financing is where the affordability crisis becomes mathematically precise. The Federal Reserve’s rate hiking cycle from March 2022 through mid-2023 — 525 basis points of increases — transmitted directly into auto loan rates with an approximate 6–12 month lag. By early 2024, the average new vehicle auto loan rate had climbed to 9.0–9.5% for buyers with average credit (660–720 FICO). Subprime borrowers (below 620 FICO) faced rates of 14–18% or higher. Used vehicle financing, which has always carried higher rates than new, hit 13–14% on average for non-prime borrowers.
The Federal Reserve’s rate cuts in late 2024 and 2025 provided modest relief — the federal funds rate came down 100 basis points in three cuts — but auto loan rates are indexed to longer-term benchmarks (typically 3- or 5-year Treasury yields) rather than the overnight rate. The transmission was slow and partial. By Q1 2026, the average new vehicle loan rate had eased to approximately 8.5%, but this remains dramatically higher than the 4–5% environment of 2019–2021.
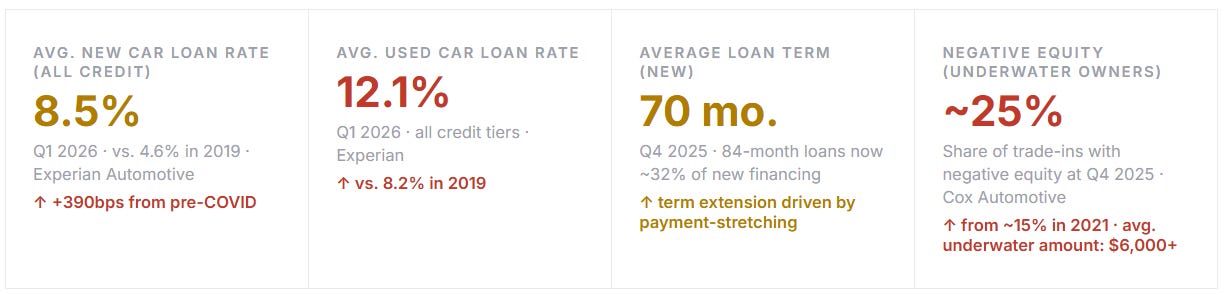
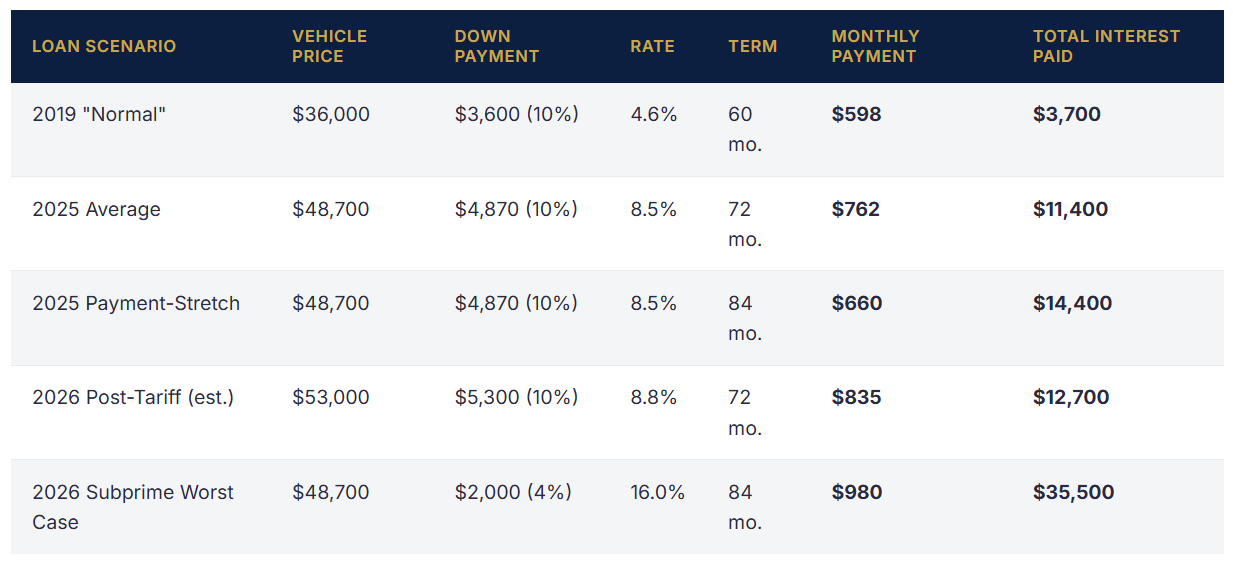
The 84-month loan term — 7 years — deserves special attention because it represents a structural change in how Americans finance transportation. In 2015, 84-month loans were a small fraction of auto financing. By 2025, nearly one in three new vehicle loans extended to 84 months. The math is stark: at 8.5% on a $48,700 vehicle with a $5,000 down payment, a 72-month loan produces a $762 monthly payment. An 84-month loan on the same vehicle produces $660 — but the total interest paid rises from $11,400 to $14,400. Buyers are paying significantly more over the life of the loan to manage the monthly payment to a level that fits their budget. The downstream consequence is persistent negative equity — by month 36 on an 84-month loan, the borrower often owes more than the vehicle is worth in the used market.
⚠️ The Negative Equity Trap — How 25% of American Car Owners Are Underwater
Negative equity (owing more on a car loan than the vehicle is worth) creates a self-reinforcing debt cycle. When a negative-equity owner wants to trade in or is forced to sell, the deficit rolls into the next loan. Cox Automotive estimates that the average “upside-down” trade-in in Q4 2025 carried $6,100 in negative equity — which typically gets added to the new vehicle’s loan balance, increasing the new monthly payment and creating new negative equity faster. This roll-over dynamic contributed to the surge in sub-prime auto loan balances. New York Fed data shows total outstanding auto loan debt hit a record $1.66 trillion in Q4 2025, with the non-prime and subprime portion growing faster than prime.
The Repo Surge
Repossessions: Back to Crisis Levels — What the Data Shows
Repossession data is among the most lagging and least-publicized indicators in consumer finance, but it is among the most economically revealing. Lenders do not typically publicize repo rates; the data emerges from credit bureau reports, lender disclosures, and industry tracking firms like Cox Automotive, S&P Global Mobility, and repossession industry associations. What that data shows for 2024–2025 is unambiguous: auto repossessions surged to their highest level since the aftermath of the 2008 financial crisis.
The trajectory follows a logical sequence. The COVID period (2020–2021) produced artificial lows in repossession activity: forbearance programs kept distressed borrowers current, stimulus payments covered car payments, and the used car price surge meant that even borrowers who fell behind could sell their vehicle above the loan balance and avoid repossession. That anomaly ended. As forbearance programs expired, stimulus dried up, and used car prices normalized from pandemic peaks, the cohort of borrowers who were extended credit at peak 2020–2022 prices (often with minimal down payments at high loan-to-value ratios) began defaulting in earnest. The repossession wave that arrived in 2023 and intensified through 2024–2025 is the direct result of that underwriting vintage.
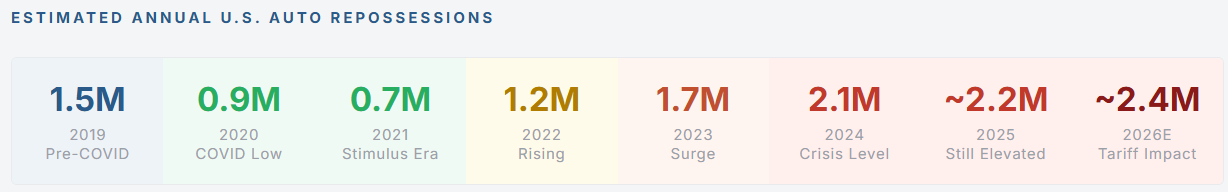
The 2024 figure of approximately 2.1 million repossessions represents a 40% increase from pre-COVID 2019 levels, and a 200% increase from the 2021 pandemic low. Industry analysts at Cox Automotive, Manheim, and S&P Global have all flagged the trend as beyond normal cyclical normalization. Several factors compound the headline number: the average repossession now takes longer because lenders are giving more extensions (which delays the repo but often means the borrower is more deeply in default when it occurs); the vehicles being repossessed are worth less relative to the outstanding loan balance (higher LTV at origination plus used-price normalization); and the repo-to-auction pipeline is overwhelmed, which is suppressing recovery values for lenders and further tightening subprime credit availability.
🔴 Subprime Auto: The Canary in the Consumer Credit Coal Mine
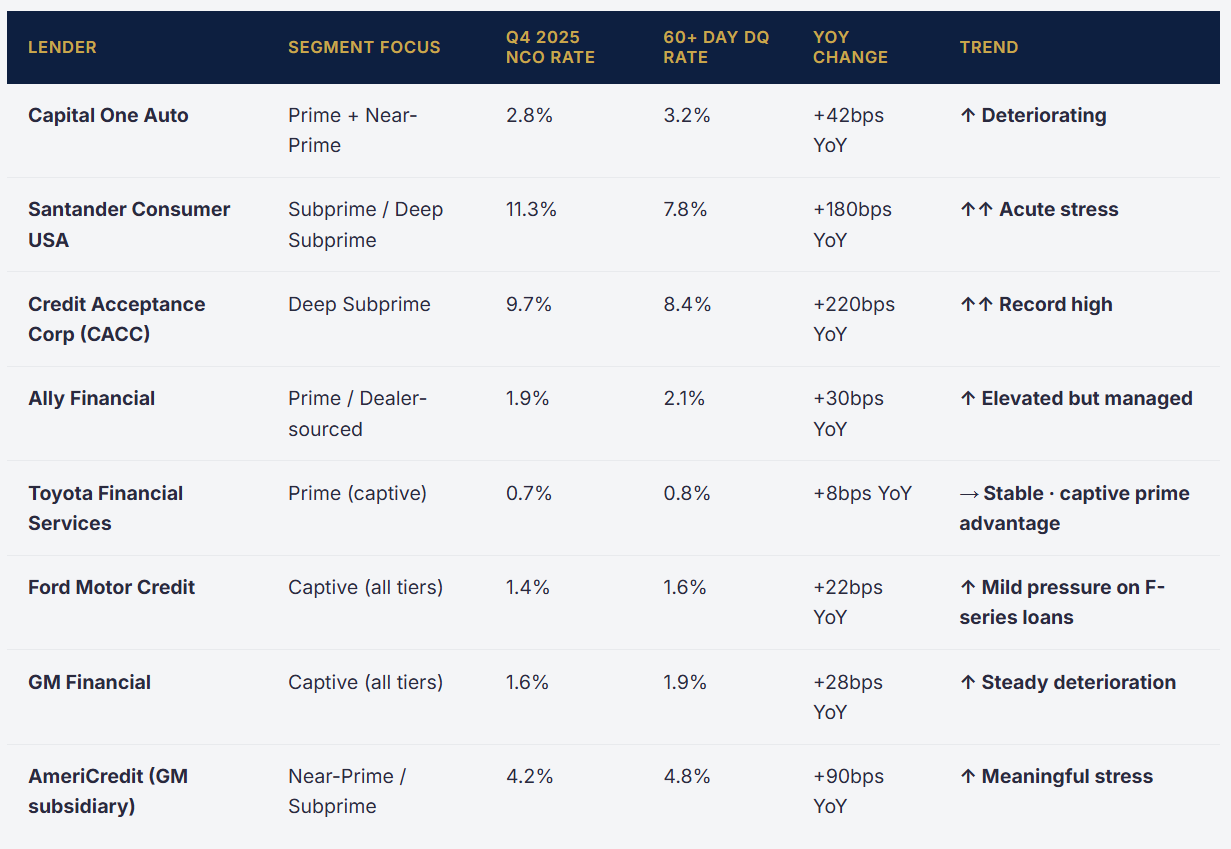
The subprime auto loan market ($500B+ in outstanding balances) is flashing the most acute stress signals in the consumer credit complex. Annualized net charge-off rates at major auto lenders — Capital One Auto, Santander Consumer USA, Credit Acceptance Corporation — have risen to 8–11% on subprime portfolios, double their 2019 levels. The KBRA Auto Loan Index for subprime shows 60+ day delinquencies at 6.2% in Q4 2025, the highest in the index’s history. Capital One, the largest bank auto lender, disclosed that auto loan net charge-offs rose 40bps year-over-year in Q4 2025. Santander Consumer’s subprime book saw charge-offs above 11% annualized. These are not pre-crisis warning signs — these are crisis-level numbers, confined currently to the subprime segment. The question is whether they stay there.
The Used Market
Used Vehicle Prices: The Post-COVID Hangover and What Comes Next
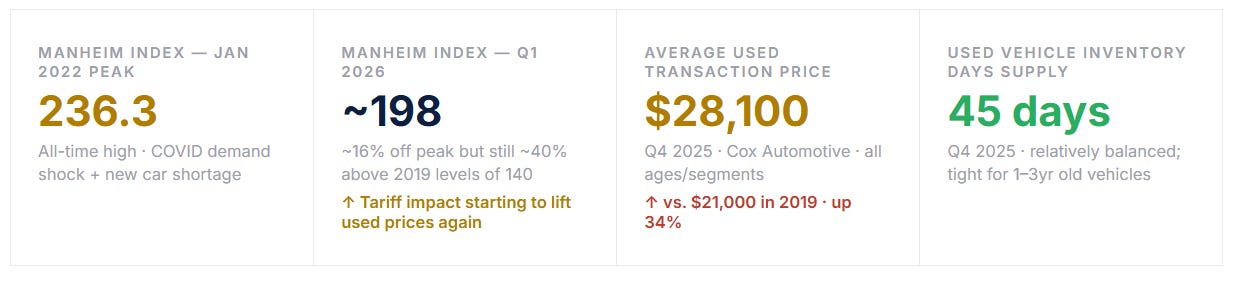
The Manheim Used Vehicle Value Index — the benchmark pricing gauge for the wholesale used car market — peaked at 236.3 in January 2022, reflecting the extraordinary demand-supply imbalance of the COVID era when new vehicle shortages pushed millions of buyers into the used market simultaneously. From that peak, used prices fell steadily through 2022–2024, with the Index declining to approximately 195–200 by late 2024. That represents a roughly 15% decline from peak — meaningful but not catastrophic, and still significantly above the pre-COVID norm of 130–140.
The key insight is that used vehicle prices did not return to pre-COVID levels. A used car that cost $18,000 in 2019 might cost $23,000 today — elevated by 25–30% even after the post-COVID correction. For buyers who cannot afford new vehicle prices (or cannot qualify for new-vehicle financing), the used market provides limited relief because used prices themselves are structurally elevated and the financing rates on used vehicles are significantly higher than on new vehicles (12% vs 8.5%), often more than offsetting any sticker savings.
The tariff shock is creating a secondary used market dynamic worth watching. If new vehicle prices rise $3,000–$8,000 due to import tariffs, demand that would have flowed into new vehicles shifts to used. This incremental used-market demand arrives at precisely the moment when used inventory is already lean (low new-vehicle production during COVID constrained the pipeline of 3–5 year old used vehicles that hit the market in 2023–2025). The result could be a Manheim Index re-inflation — used prices rising from tariff displacement demand rather than genuine consumer strength. Early data from April 2026 dealer auctions shows a 2–3% wholesale price uptick that analysts are partially attributing to tariff-anticipation buying.
