


Automotive Financial Trends 2020-2023: Market Cap, Investment Analysis & Stock Movements of Top Car Manufacturers
Insights into the Financial Landscape: Tracking Capital Expenditures, Stock Activities, and Revenue Growth of Leading Auto Brands


In today's rapidly evolving automotive industry, understanding the financial maneuvers of leading players is paramount. Dive into a comprehensive analysis that captures the essence of capital expenditures, stock activities, and revenue trajectories of top automakers. Gain insights into strategies, investment trends, and market positions that define the contemporary auto landscape.
Top 10 Automakers By Market Cap
Over the past three years, the market capitalization of major automobile companies has experienced notable fluctuations. Tesla's market cap skyrocketed from $200.17 billion in Q2 2020 to a peak of $1,113.71 billion in Q1 2022, before retracting to $829.68 billion by Q2 2023. Toyota, a traditionally dominant player, saw steady growth, reaching $216.86 billion in Q2 2023. Porsche entered the metrics in Q2 2022 with a market cap of $73.65 billion and settled at $96.25 billion by Q2 2023. BYD showcased impressive growth, more than tripling its market cap from Q2 2020 to Q2 2023. Mercedes Benz, BMW, Volkswagen, and Honda maintained relatively stable valuations over the period. Stellantis, emerging in Q1 2021, had a cap of $54.72 billion by Q2 2023. Ferrari, known for its luxury cars, saw a consistent rise, reaching $58.97 billion in Q2 2023. Collectively, the top 10 companies had a market cap of $633.20 billion in Q2 2020, which surged to $1,850.97 billion in Q4 2021, indicating the significant growth and resilience of the automobile sector.
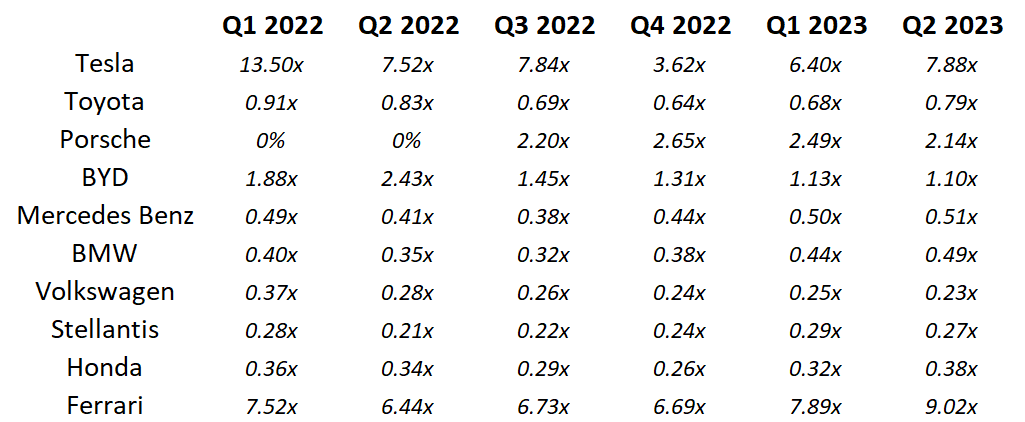
Next Twelve Months (NTM) Price/Sales (P/S) ratios
From Q2 2020 to Q2 2023, the Next Twelve Months (NTM) Price/Sales (P/S) ratios for the automotive companies have demonstrated distinct trajectories and valuations. Tesla, showcasing its status as a tech-forward automaker, maintained a high P/S ratio, peaking at 15.34x in Q4 2020 but experiencing a significant drop to 3.62x by Q4 2022. Still today, Tesla’s Multiple is very high compared to its peers and very high compared to historical averages. Traditional automakers like Toyota, Mercedes Benz, BMW, and Honda hovered within a narrower range, with Toyota's ratio increasing from 0.75x to 0.79x and Honda's showing a slight increase from 0.37x to 0.38x. Volkswagen's ratio, starting at 0.32x, diminished to 0.23x, highlighting its conservative valuation. Interestingly, Porsche, which had no data until Q3 2022, ramped up to a P/S of 2.65x in Q4 2022. BYD, an electric vehicle manufacturer, experienced fluctuations, peaking at 3.37x in Q2 2021 before settling at 1.10x in Q2 2023. Ferrari, known for its luxury niche, maintained a higher ratio, oscillating around 7-9x. The data accentuates the market's higher valuation of innovative and luxury brands over traditional automakers.
Revenue Growth:
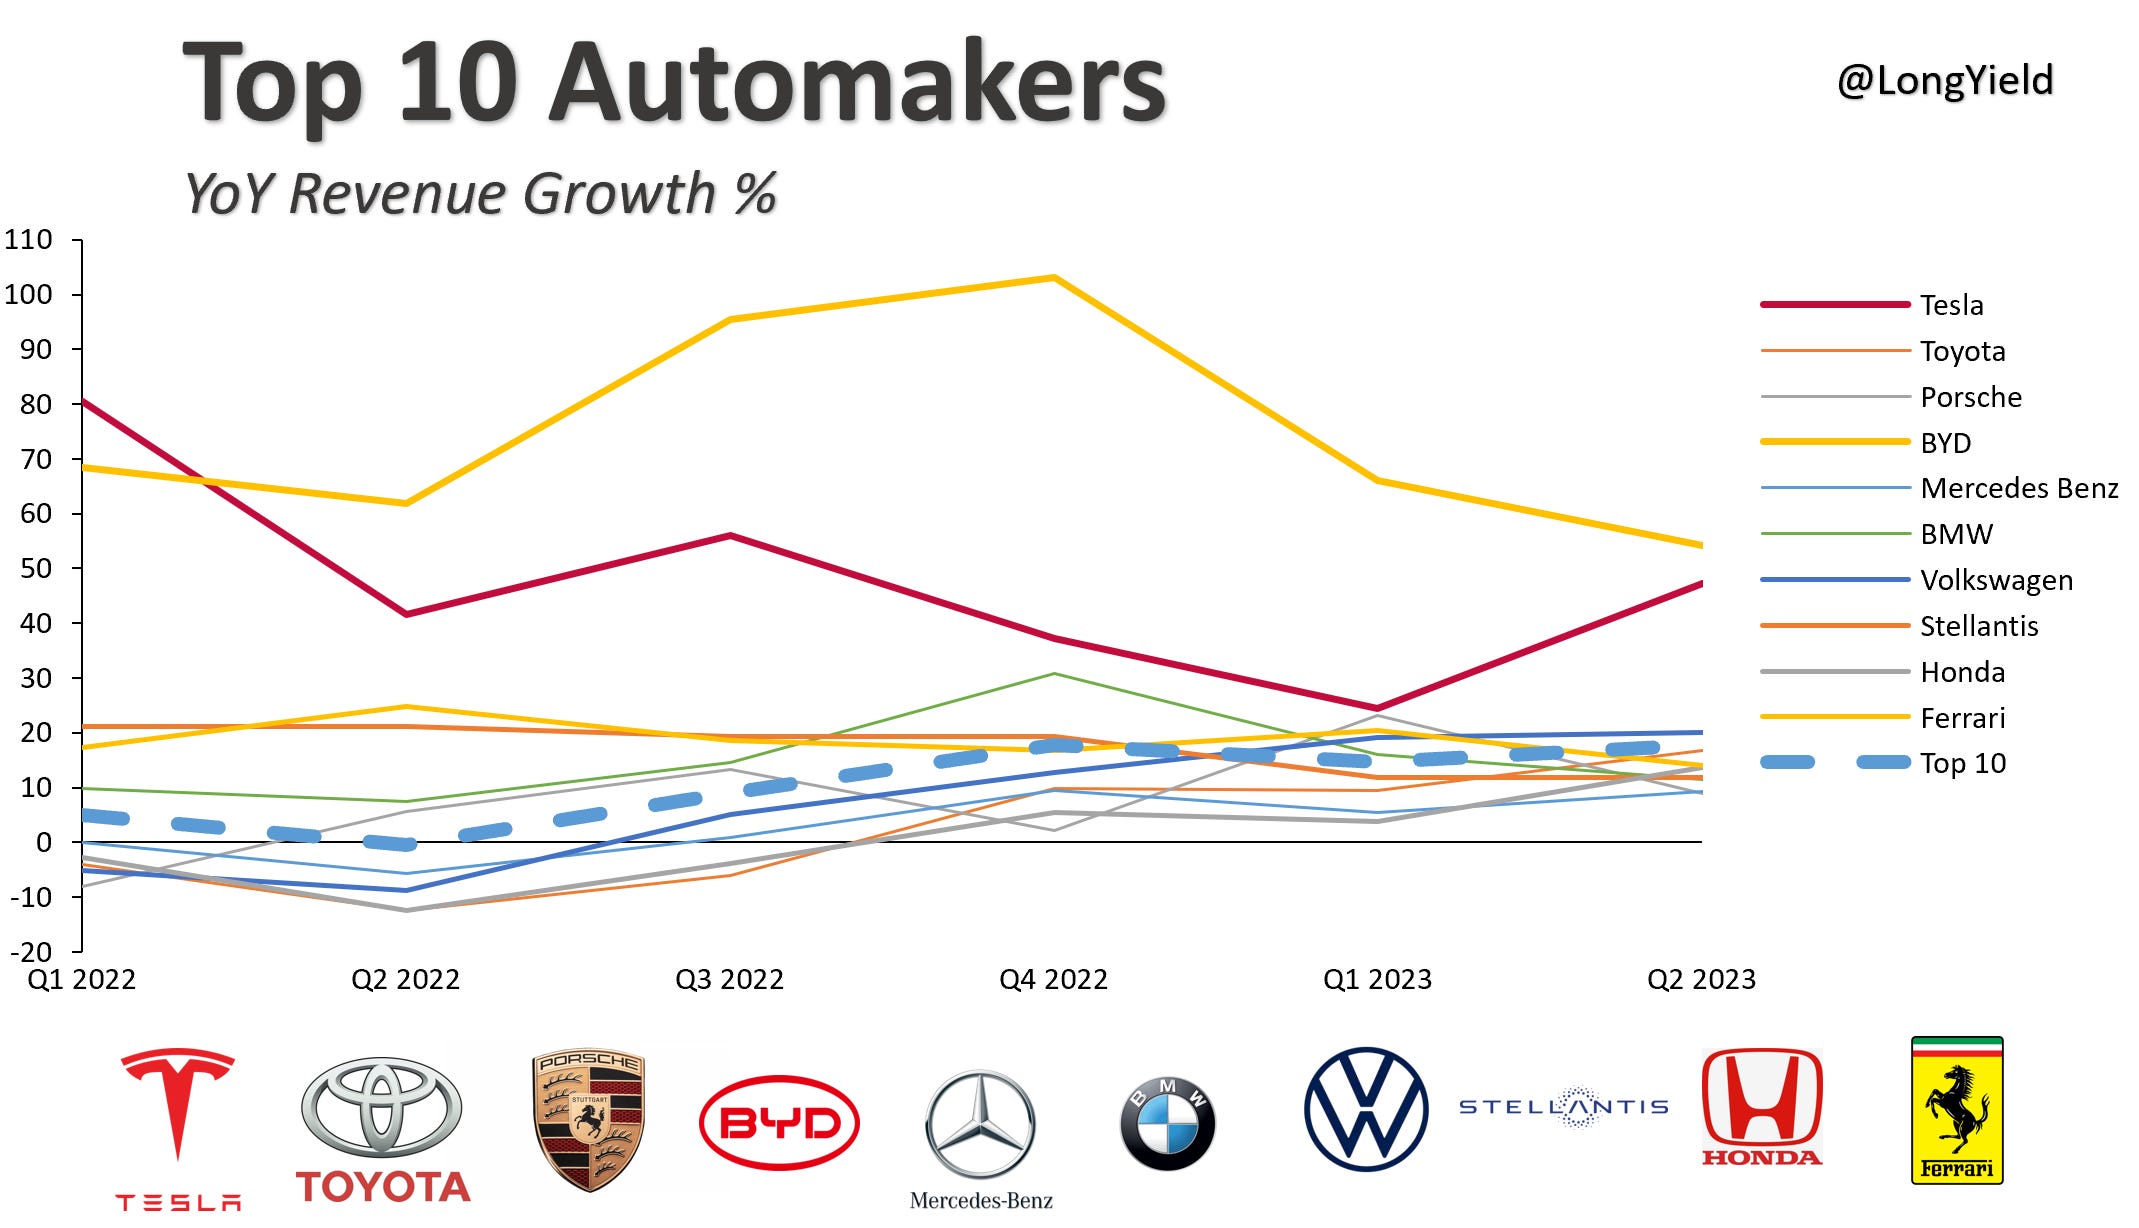
Year-on-Year Revenue Growth in the Auto Sector:
The year-on-year growth data paints a vivid picture of the dynamic automotive landscape.
Leading the charge is BYD ( BYD 0.00%↑ ), showcasing unparalleled growth vigor, with a crescendo at a staggering 103% in Q4 2022. This trajectory is a testament to their aggressive market strategies and potential dominance in the electric vehicle arena. Tesla ( TSLA 0.00%↑ ), the EV behemoth, started strong at 81% in Q1 2022 and, despite the natural tapering off of such high figures, managed to sustain a robust 47% by Q2 2023.
On the flip side, giants like Toyota ( TM 0.00%↑ ) and Honda ( HMC 0.00%↑ ) grappled with headwinds in early 2022, reflecting in negative growth figures. However, their resilience shines through as they pivot to positive territories in subsequent quarters. Luxury mainstays like Porsche ( $POAHY ), BMW ( $BMWYY), Mercedes Benz ( $DMLRY ), and Ferrari ( RACE 0.00%↑ ) have showcased fairly consistent growth, emphasizing their undying allure in the premium segment.
Volkswagen's ( $VWAGY ) journey from a slump of -9% in Q2 2022 to a hearty 20% by Q2 2023 is emblematic of adaptive strategies, perhaps hinting at successful product launches or market initiatives. Stellantis ( STLA 0.00%↑ ), with its unwavering positive figures, underscores its balanced portfolio and strategic foresight.
The cumulative data for the top 10, reflected in an average growth trajectory, sees a muted start in 2022 but gains momentum to reach a commendable 18% by Q2 2023. This suggests an industry on the rebound, with bright prospects on the horizon.
Keep reading with a 7-day free trial
Subscribe to LongYield to keep reading this post and get 7 days of free access to the full post archives.