GDP Collapsed, Inflation Won’t Die, and Manufacturing Is Surging—What’s Really Happening to the U.S. Economy?

A. Executive Summary
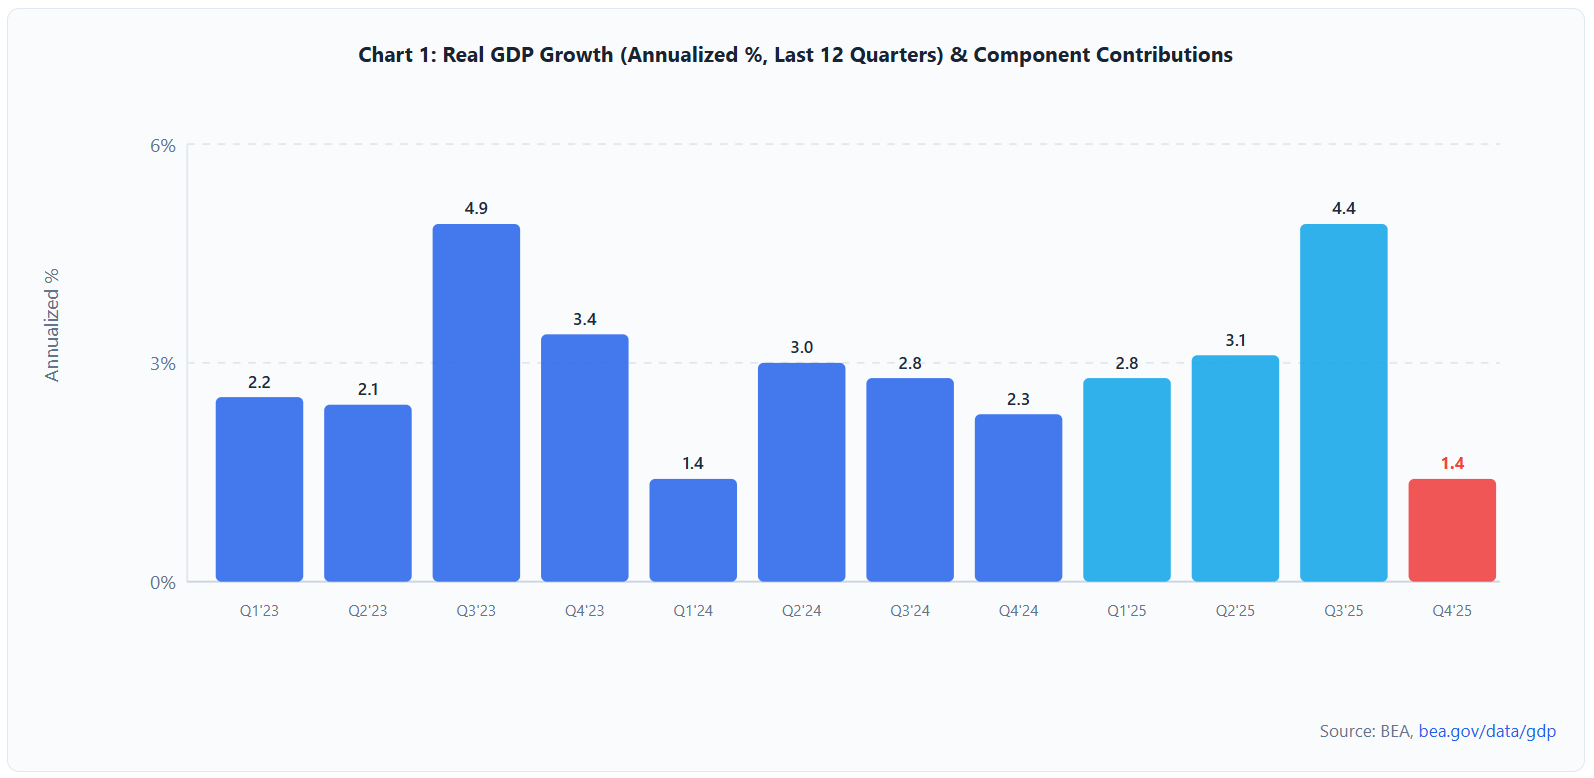
GDP disappointed: Q4 2025 advance estimate printed at just 1.4% annualized (vs. 4.4% in Q3), dragged by a 43-day federal government shutdown that subtracted ~1.0 pp. (BEA, Feb 20)
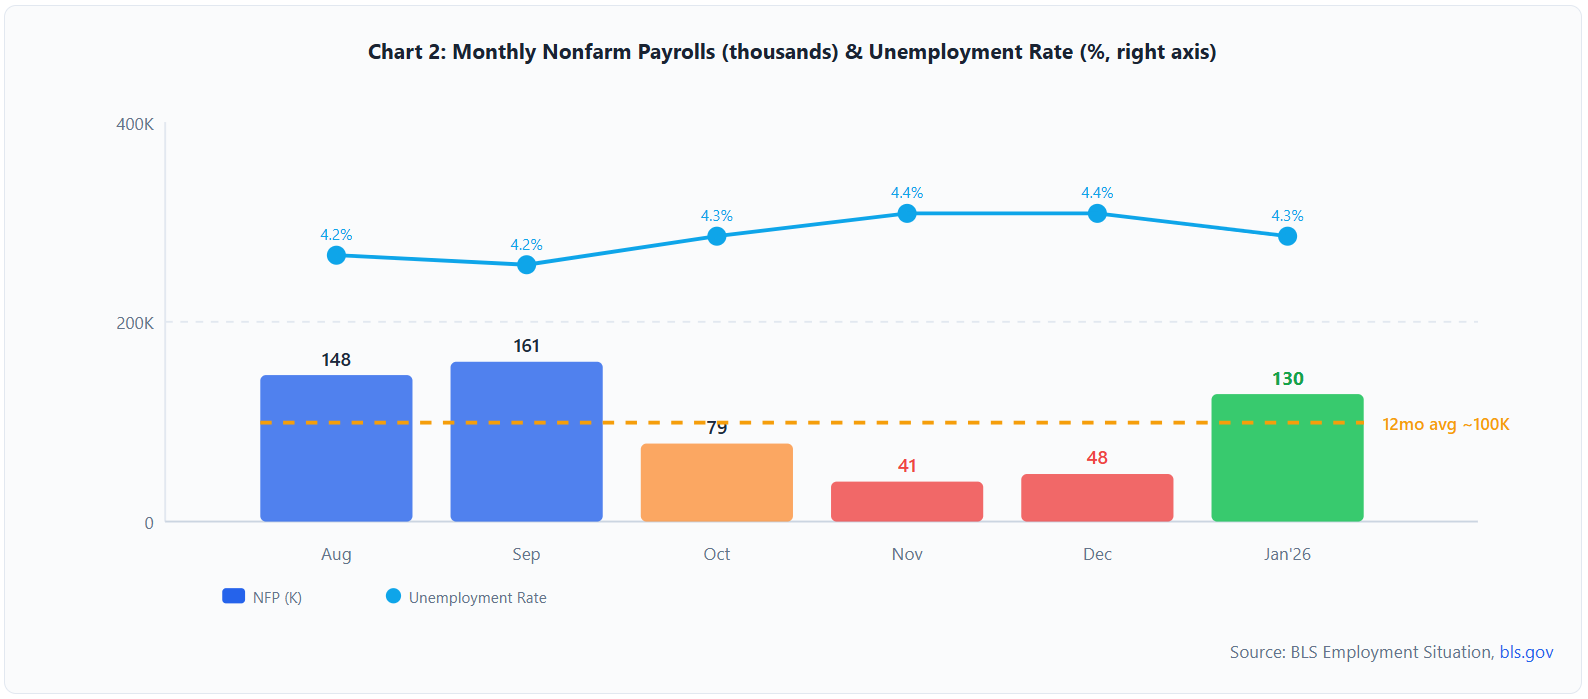
Payrolls surprised to the upside: +130K in January versus a 55K consensus, though a -898K benchmark revision to 2024-25 levels tempers the enthusiasm. (BLS, Feb 11)
Unemployment ticked down: U-3 fell to 4.3% from 4.4%; participation edged up to 62.5%. The labor market is cooling but not cracking.
Manufacturing broke through: ISM Manufacturing PMI surged to 52.6 — the first expansion reading in 12 months — with new orders at 57.1, signaling a potential industrial rebound. (ISM, Feb 3)
Headline CPI fell to 2.4% YoY (from 2.7%), beating expectations of 2.5%. Core CPI at 2.5% YoY matches consensus. Energy deflation drove the gap. (BLS, Feb 13)
PCE inflation remains stubborn: December core PCE at 3.0% YoY — well above the Fed’s 2% target and above consensus — keeps the “last mile” problem alive. (BEA, Feb 20)
Consumer confidence cratered: Conference Board index plunged to 84.5 (lowest since 2014), while Michigan Sentiment rose modestly to 56.4. Soft data and hard data are diverging.
Housing remains frozen: Existing home sales fell 8.4% MoM to 3.91M SAAR; builder sentiment dropped to 37. Mortgage rates near 6.1% are helping at the margin but not enough.
Trade deficit surged: December goods-and-services deficit hit $70.3B, well above the $55.5B estimate, pointing to front-loading ahead of tariff uncertainty. (BEA, Feb 6)
The Fed held steady at 3.50-3.75% on January 28. Two dissenters preferred a cut. Markets see one more cut in 2026, timing uncertain.
Financial conditions remain loose: IG spreads at 71 bps (tightest since 1998), NFCI at -0.57, S&P 500 near 6,900. Risk appetite is high despite macro cross-currents.
Signal vs. Noise: The GDP miss is partly shutdown-driven (noise), but the ISM breakout and payroll beat (signal) suggest underlying momentum. Inflation’s stickiness above 2% is the genuine risk to the soft-landing narrative.
B. Dashboard Scorecard
Each category is scored 1–5 based on how supportive that dimension is for continued expansion: 1 = Deteriorating rapidly, 2 = Weakening, 3 = Neutral/Mixed, 4 = Solid, 5 = Very Strong. Direction arrows indicate the month-over-month trajectory.
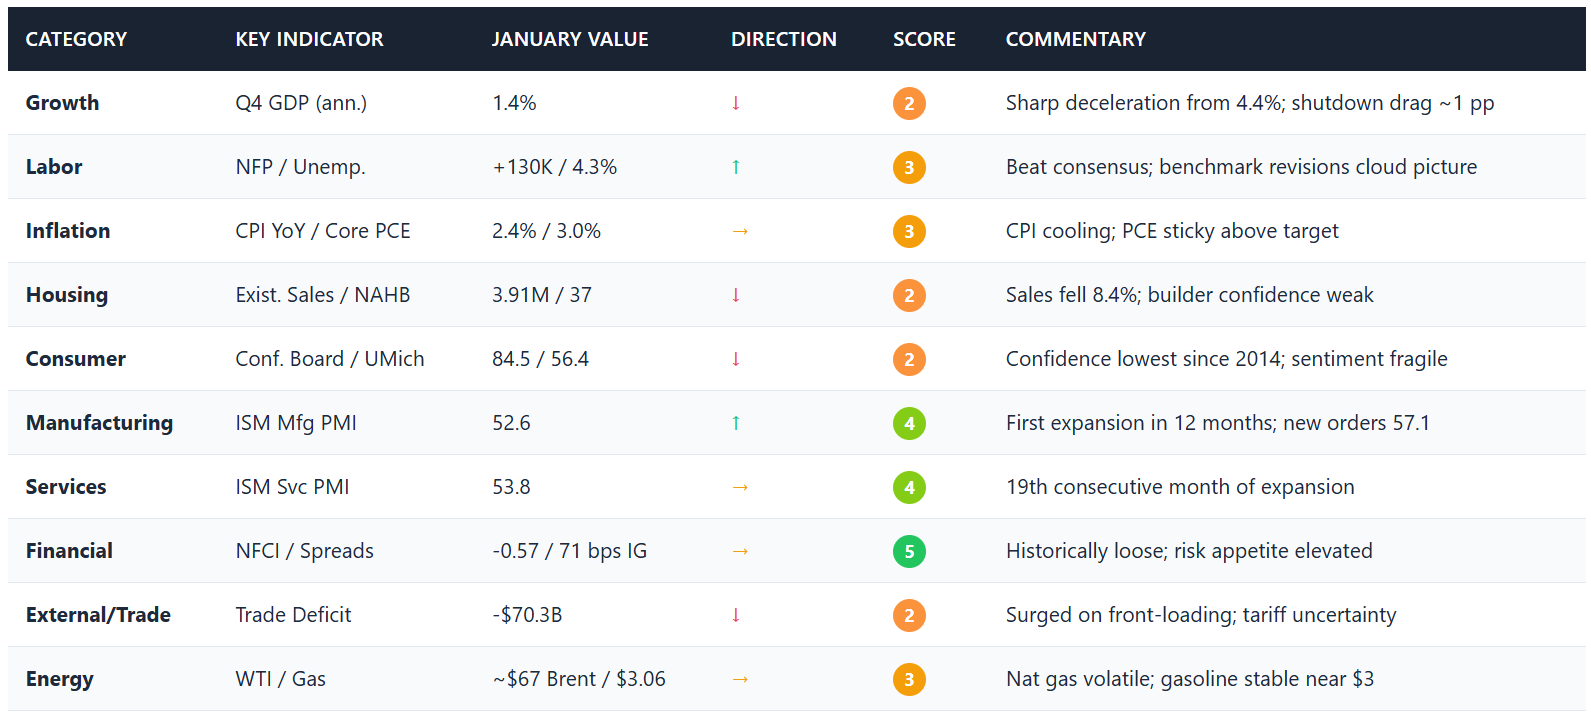
Composite Score: 3.0 / 5.0 — The economy is in expansion but losing momentum, with a meaningful divergence between hard data (mixed-to-positive) and soft survey data (negative).
C. Growth & Output
GDP: Q4 2025 Advance Estimate
The Bureau of Economic Analysis released the advance estimate for Q4 2025 GDP on February 20, 2026, showing real GDP grew at a 1.4% annualized rate — a sharp deceleration from 4.4% in Q3 and well below the consensus range of 2.5-3.0%. The 43-day federal government shutdown (October 1 through November 12, 2025) subtracted approximately 1.0 percentage point from headline growth through reduced federal spending.
Consumer spending remained the primary growth engine, with PCE contributing +2.4 pp (services +3.4%, led by healthcare). Business fixed investment grew 3.7%, driven by AI-related capital expenditure. Residential investment fell 1.5% for the fourth consecutive quarterly decline. The PCE price index rose 2.9% in Q4.
January High-Frequency Indicators
Industrial production surged 0.7% MoM in January (released Feb 18), beating expectations and marking the strongest gain since mid-2025. Manufacturing output rose 0.6%, with broad-based gains in durables (+0.8%) and nondurables (+0.4%). Capacity utilization improved to 76.2% from 75.7%, though still 3.2 pp below the long-run average. January retail sales data was delayed by government scheduling disruptions; early proxies (CNBC/NRF card data) suggest a modest +0.2% MoM gain.
Key Takeaway — GrowthThe GDP headline looks alarming at 1.4%, but roughly 1.0 pp of the miss reflects the October-November shutdown — a one-off drag. Underlying consumer and business investment momentum appears intact. January's industrial production rebound and the ISM manufacturing breakout suggest Q1 2026 could see a meaningful reacceleration.
D. Labor Market
The January employment situation report (released February 11) delivered a notable upside surprise: nonfarm payrolls rose 130,000 versus a Dow Jones consensus of 55,000. The unemployment rate ticked down to 4.3% from 4.4%, and labor force participation edged up 0.1 pp to 62.5%. Average hourly earnings grew 0.4% MoM and 3.7% YoY — slightly above the 0.3% MoM consensus.
However, the accompanying annual benchmark revision was historic: the BLS revised total payroll levels downward by 898,000 jobs for the April 2024-March 2025 period — the second-largest negative adjustment ever. This means that the job gains throughout 2024 and early 2025 were significantly overstated.
The JOLTS report for December 2025 (released February 5) showed job openings fell to 6.5 million — the lowest since late 2017 excluding the pandemic — with the openings rate dropping to 3.9%. The quits rate held at 2.0%, and layoffs remained subdued at 1.8 million. Weekly initial claims during January ranged from 198K to 231K, with the late-January spike to 231K attributed partly to winter storm disruptions.