
Inditex: The Compounding Machine of Global Retail
Record FY2025 results reveal the durability of Inditex’s model—high margins, exceptional cash generation, and accelerating constant-currency growth despite currency headwinds.

Disclaimer: This report is for informational purposes only and does not constitute investment advice, a recommendation, or a solicitation to buy or sell any security. All data is sourced from public filings, earnings releases, and third-party research
Executive Summary
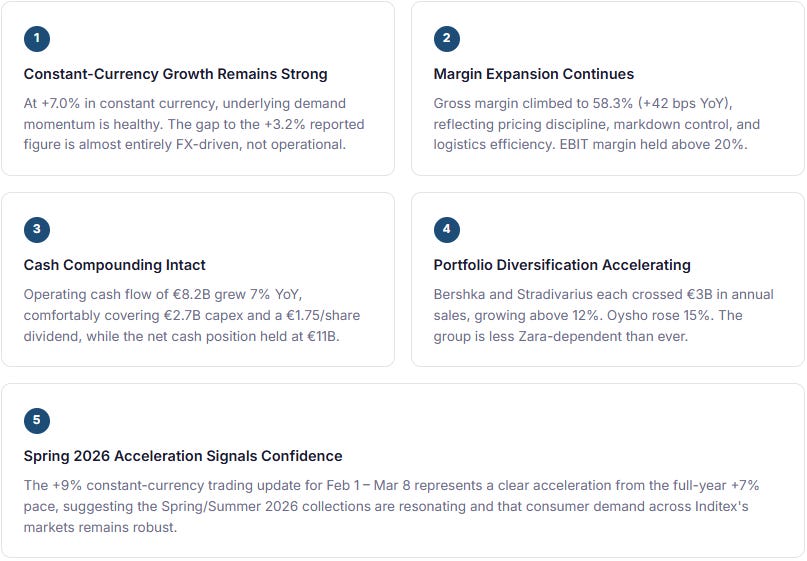
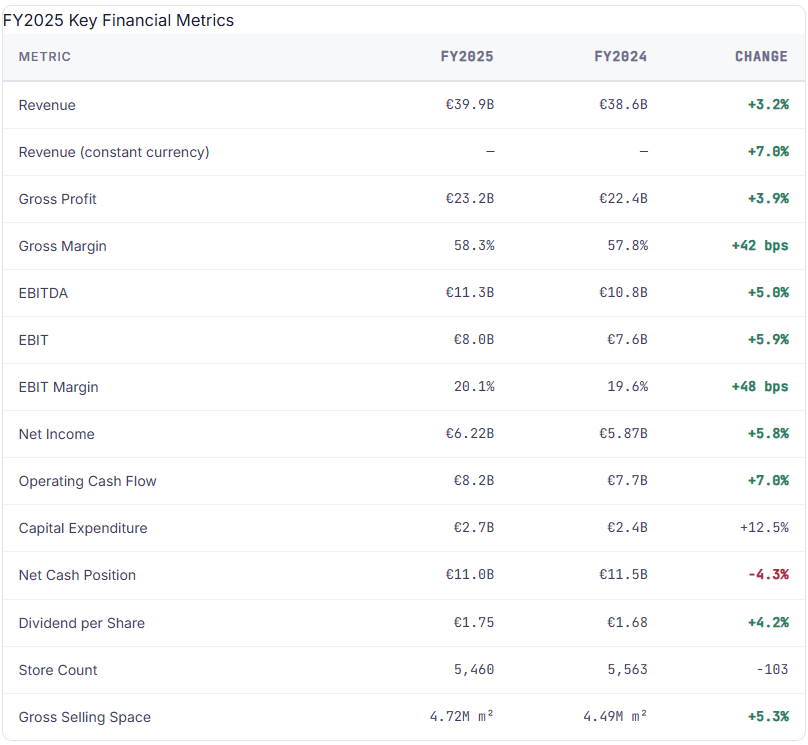
Inditex delivered record FY2025 results that reaffirm the structural quality of its operating model. Sales rose to €39.9 billion, growing 7.0% at constant currency despite a roughly four-percentage-point foreign-exchange headwind that compressed reported growth to 3.2%. Net income reached €6.22 billion, up approximately 6% year-on-year, while gross margin expanded 42 basis points to 58.3%—a level virtually unmatched among mass-market apparel operators globally.
Cash generation remained exceptional: operating cash flow topped €8.2 billion, comfortably funding a €2.7 billion capital expenditure programme and a proposed dividend of €1.75 per share. The balance sheet closed the year with approximately €11.0 billion in net cash. Most strikingly, the spring 2026 trading update revealed a +9% constant-currency acceleration in store and online sales for the February 1 – March 8 window, suggesting the growth engine is gaining, not losing, momentum heading into FY2026.
This article reviews every major dimension of the results: revenue quality, margin resilience, cash-flow economics, store strategy, omnichannel integration, geographic performance, capital allocation, and the 2026 outlook. The central finding is clear: Inditex’s latest numbers confirm it remains one of the highest-quality consumer businesses in the world, and the near-term deceleration visible in reported headline growth tells investors far less than the underlying constant-currency operating trajectory.
Key Takeaways
Five Things That Matter Most
Section I
The Latest Results in Context
Inditex’s FY2025 fiscal year ended on January 31, 2026. The results represent a 12-month period that spanned a complex consumer environment: sticky services inflation, uneven European growth, geopolitical disruption, and a strong US dollar that eroded the translation value of international revenues back into the euro reporting currency.
Against that backdrop, the headline numbers are unambiguous. Revenue reached €39.9 billion, up from €38.6 billion in FY2024. Reported growth of 3.2% understates the operating picture because adverse currency movements shaved roughly four percentage points off the top line. In constant-currency terms, growth was 7.0%—a pace that would be considered outstanding for a business of Inditex’s scale in any consumer environment, let alone this one.
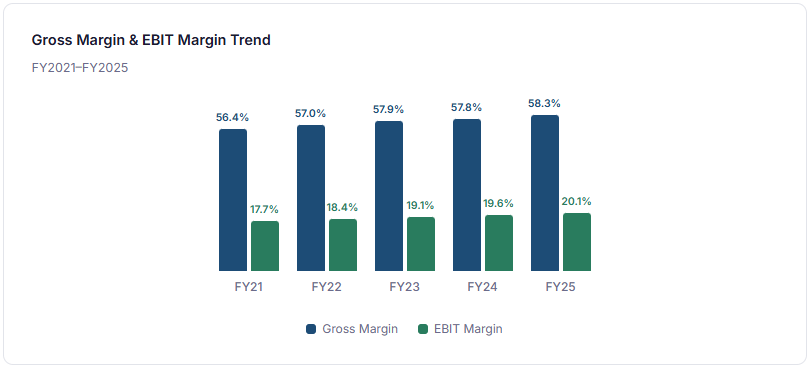
EBITDA rose to approximately €11.3 billion (+5% YoY), and EBIT expanded to €8.0 billion (+5.9% YoY). Net income reached €6.22 billion, beating consensus estimates by roughly 6%. Gross margin improved 42 basis points to 58.3%, suggesting that the pricing-and-sourcing architecture of the business continues to deliver real operating leverage even in a lower-growth reported environment.
The market had broadly expected a solid set of numbers but was particularly encouraged by the early trading update: constant-currency sales growth of +9% through the first five weeks of FY2026. This acceleration from the +7% full-year pace reduced fears that Inditex was heading into a deceleration phase and re-established the narrative that the company can grow sustainably at mid-to-high-single-digit rates in real terms.
Section II
Revenue Review: What Drove Growth
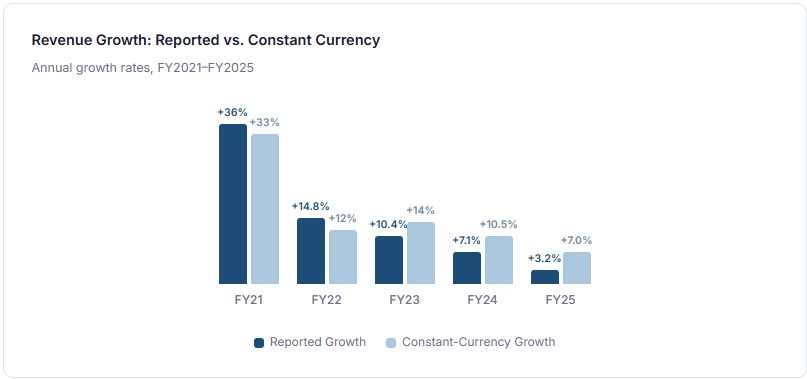
The distinction between reported and constant-currency growth is not a technicality for Inditex—it is the single most important analytical lens through which to read the top line. The company generates roughly 84% of revenue outside Spain and over half outside Europe entirely, making it acutely sensitive to currency translation effects that have nothing to do with underlying consumer demand. In FY2025, the euro’s strength against a basket of emerging-market currencies and the US dollar created an approximately four-point drag, turning what was genuinely strong operating growth into what looked like modest reported growth.
Revenue drivers across the year were broad-based. Constant-currency growth accelerated sequentially, from roughly 5% in the first half to 8.4% in the third quarter, before maintaining strong momentum into the final quarter. This acceleration pattern is unusual and significant: it suggests Inditex gained competitive traction as the year progressed, driven by strong collection execution, store-network upgrades, and intensifying consumer engagement.
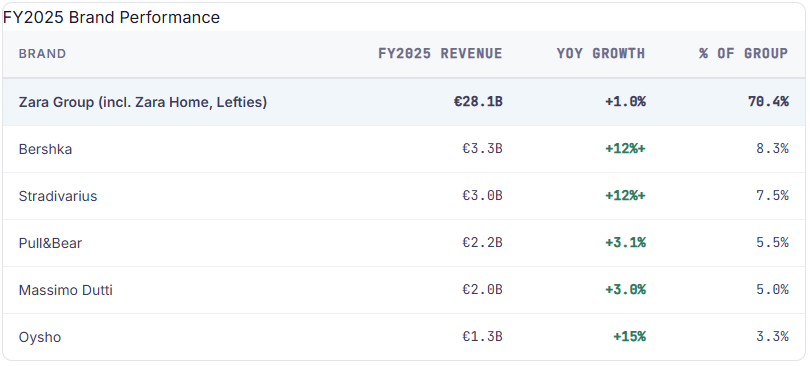
Brand-level analysis reveals a portfolio that is becoming more diversified and less Zara-dependent. Zara (including Zara Home and Lefties) generated €28.1 billion in revenue—still 70% of the group—but grew only 1% in reported terms. The real growth engines were the mid-price and youth brands: Bershka crossed €3.3 billion (up over 12%), Stradivarius topped €3.0 billion (up over 12%), and Oysho grew approximately 15%. This portfolio balance reduces concentration risk and suggests that Inditex is finding new vectors of growth beyond Zara alone.
Store productivity also contributed. Gross selling space expanded 5.3% (with net space growth of approximately 1.5% after absorptions), and the group opened 190 new stores while absorbing 293 smaller locations. The net effect is fewer but substantially larger and more productive stores, a structural shift that improves revenue per square metre, footfall quality, and brand presentation.
Section III
Profitability Review: Gross Margin, EBIT, and Net Income
Inditex’s profitability profile is not just good relative to apparel peers—it is structurally anomalous. A gross margin of 58.3% in mass-market fashion, combined with an EBIT margin above 20%, positions the company closer to premium luxury houses than to the fast-fashion operators it is typically grouped with. Understanding why this margin quality persists, and whether it is sustainable, is essential to any serious assessment of the investment case.
The 42-basis-point improvement in gross margin in FY2025 reflects several converging factors. First, Inditex’s vertically integrated sourcing model—proximity manufacturing in Spain, Portugal, Morocco, and Turkey for fast-turn items—allows rapid response to demand signals, reducing overproduction and the markdown burden that erodes margins at slower-moving competitors. Second, the company’s markdown discipline is exceptional: Inditex typically sells a higher proportion of full-price inventory than any peer of comparable scale. Third, logistics cost efficiencies from ongoing investment in automated distribution centres, combined with tighter inventory management (inventory ended FY2025 down 2% year-on-year despite 7% constant-currency sales growth), contributed to operating leverage.
EBIT expanded to approximately €8.0 billion, with the EBIT margin reaching roughly 20.1%—up from 19.6% in FY2024. This expansion occurred while the company was investing heavily in store refurbishments, technology, and logistics, suggesting that the incremental return on invested capital remains attractive. Net income of €6.22 billion, growing 5.8% year-on-year, translated to an EPS beat of roughly 6% versus consensus, which was the primary catalyst for the positive market reaction.
Why Inditex’s Profitability Profile Remains Unusual in Global Apparel
The combination of mass-market pricing with near-luxury margins is the result of a model that is extremely difficult to replicate. Inditex’s short production cycle (as little as two to three weeks from design to store shelf), proximity sourcing, integrated logistics, and real-time demand data create a system that minimises fashion risk—the single largest margin destroyer in apparel. Competitors running longer lead times, offshore-only sourcing, and siloed channels face structurally higher markdowns, higher inventory carrying costs, and lower sell-through rates. This is not a temporary advantage; it is an architectural one rooted in decades of capital investment and operational learning.

Key Insight
Inditex operates at mass-market price points but generates margins that sit roughly halfway between discount retailers and luxury houses. No other business of its scale and positioning replicates this margin architecture. The FY2025 results confirm this structural advantage is widening, not narrowing.
Section IV
Cash Flow, Capex, and Financial Quality
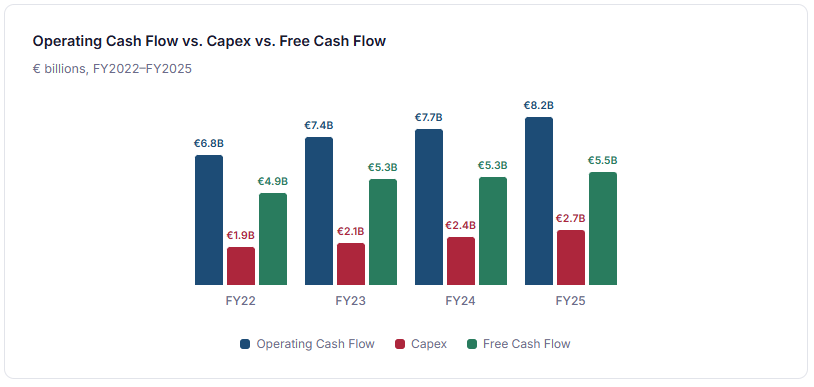
Profitability tells you how much a business earns. Cash flow tells you how real those earnings are. Inditex’s cash-flow profile is among the cleanest in global retail and provides the clearest single metric of business quality: operating cash flow of €8.2 billion in FY2025, growing 7% year-on-year, funded all investment needs and shareholder returns with room to spare.
Capital expenditure totalled €2.7 billion, representing approximately 6.8% of revenue. This included roughly €1.8 billion of ordinary capex (store openings, refurbishments, technology) plus approximately €0.9 billion from the extraordinary two-year investment programme that management announced in 2024, focused on logistics automation, next-generation store formats, and digital infrastructure. Free cash flow after capex remained comfortably above €5 billion.
Inventory management merits particular emphasis. Inventories declined approximately 2% year-on-year against 7% constant-currency revenue growth. This is a powerful indicator of operational discipline and demand-sensing capability. It means Inditex is growing sales while holding less stock—an efficiency loop that most retailers can only aspire to. Working capital dynamics were consequently favourable, supporting cash conversion at levels well above 100% of reported net income.
How to Interpret Inditex’s 2026 Capex Plan
Management guided FY2026 ordinary capex at approximately €2.3 billion, a decrease from the €2.7 billion in FY2025 because the extraordinary two-year programme is winding down. This is not a cut in investment ambition. The €2.3 billion figure represents a normalised run-rate that still commits nearly 6% of revenue to store upgrades, logistics capacity, and digital tools. Investors should read this as disciplined capital allocation, not retrenchment: the business is exiting a peak-investment cycle with substantially upgraded infrastructure, and will now harvest returns from those investments while maintaining a strong base level of reinvestment.
Section V
Store Strategy, Productivity, and the Physical Footprint
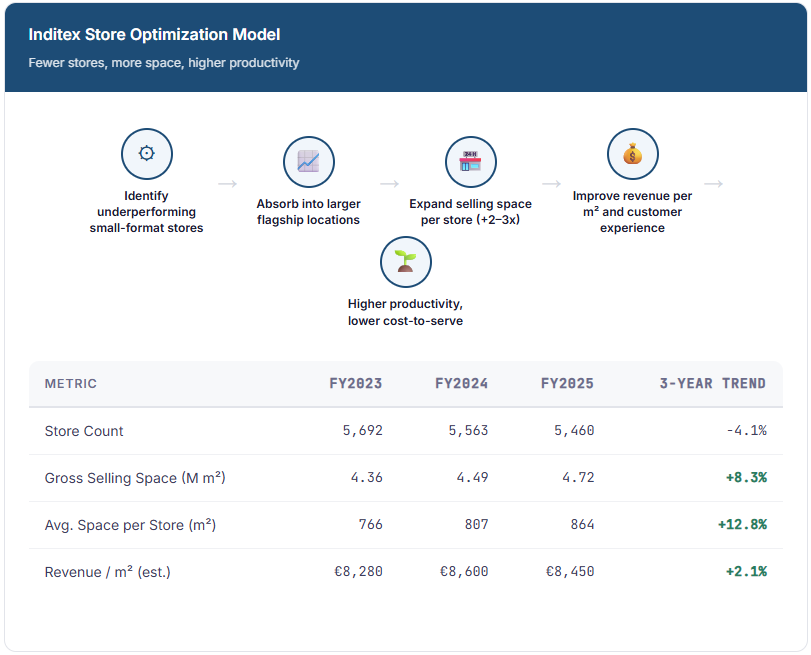
One of the most commonly misunderstood aspects of Inditex’s strategy is its store count. In FY2025, the company closed a net 103 stores, ending the year with 5,460 locations worldwide. To many observers, this looks like contraction. In reality, it reflects an ongoing quality-over-quantity transformation that has been among the most successful store-portfolio optimizations in global retail.
During FY2025, Inditex opened 190 new stores, completed 217 refurbishments (including 96 enlargements), and absorbed 293 smaller locations into larger, higher-productivity formats. Gross selling space grew 5.3% to 4.72 million square metres. The maths are straightforward: fewer doors, more total space, higher revenue per square metre, and a dramatically improved customer experience. Each net closure typically involves replacing one or two small-format shops in a secondary location with a single flagship or large-format store in a prime position, often doubling or tripling the selling area while consolidating operating costs.
Section VI
