
Lemonade: Profitability Within Sight: 70% Revenue Growth and an All-Time Low Loss Ratio
Lemonade delivered its most impressive quarter since going public — revenue surging 70.6% to $258 million, gross profit up 159%, and the gross loss ratio dropping to an all-time low of 62%

 e a lição das possíveis ações exponenciais")
The Quarter Lemonade Has Been Building Toward
When Lemonade went public in July 2020 at $29 per share and promptly surged to $183, the market was pricing in a story of radical reinvention: an AI-native insurer that would displace the legacy carriers through superior data, lower costs, and a business model that aligned company incentives with customer outcomes. Then came the losses, the runaway loss ratios, the macro reset of growth valuations, and years of skepticism from investors who wondered whether the AI-native thesis would ever translate into actual financial results.
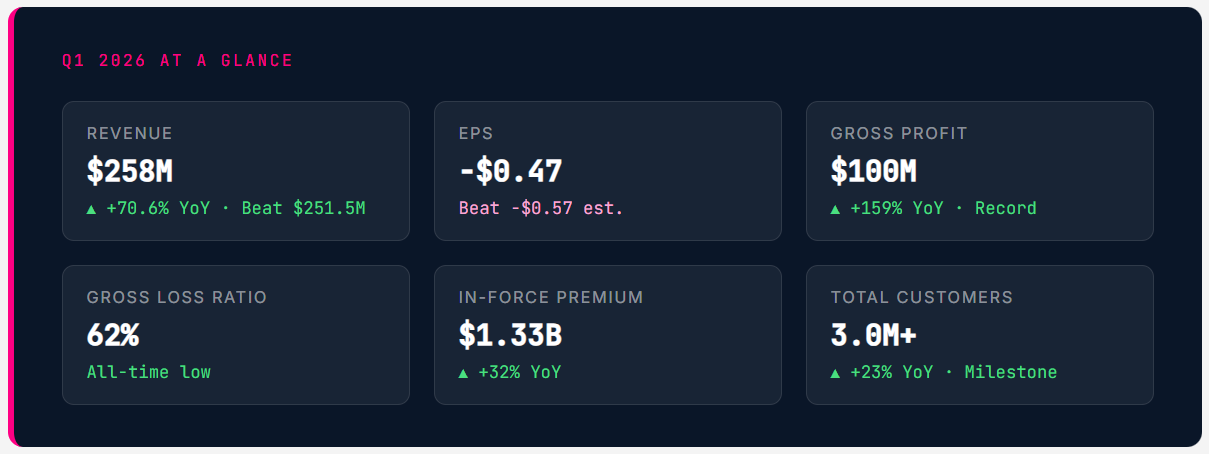
Q1 2026 is the answer to that question, and it is a resoundingly affirmative one. Revenue of $258 million grew 70.6% year over year — not a typo, not a one-time benefit — driven by a deliberate and successful strategic shift to retain more premium on Lemonade’s own balance sheet. Gross profit of $100 million, up 159% from approximately $38.6 million a year ago, represents the first time Lemonade’s underwriting economics are clearly visible at scale. A gross loss ratio of 62% — all-time low, and below the industry average for personal lines — is the statistical proof that the AI underwriting thesis is working. And an adjusted EBITDA loss of just $17 million, dramatically narrowed from $47 million in Q1 2025, shows a business moving toward the profitability inflection that management has promised for 2027.
The stock reacted accordingly. Shares rose approximately 5% in premarket trading following the release, representing a genuine beat reception rather than the sell-on-beat pattern that has plagued other growth names this earnings cycle. For Lemonade investors who have endured a multi-year holding period, this quarter validates the thesis. For those still on the sidelines, it raises the stakes: the window for skepticism about the fundamental business is narrowing.
Revenue: Reinsurance Strategy Meets Operating Leverage
To understand why Lemonade’s revenue grew 70.6% year over year while its in-force premium grew only 32%, you need to understand the company’s evolving relationship with its reinsurance partners — and why that relationship shift is the single most important driver of Lemonade’s financial transformation.
Lemonade’s revenue is primarily composed of gross premiums earned, net of amounts ceded to reinsurers. In the company’s early years, Lemonade ceded the vast majority of its premium to quota share reinsurance partners — in some periods, upwards of 75–80% of every premium dollar collected was immediately passed on to reinsurers. This kept Lemonade’s net exposure low during a period when its loss ratio was uncertain and its actuarial track record was short, but it also dramatically compressed the revenue that showed up on the income statement. The company was collecting the premium but booking only a fraction as revenue.
As Lemonade’s AI-driven pricing models have improved, its gross loss ratios have declined steadily to the current all-time low of 62%. That improvement gave management the actuarial confidence to renegotiate cession arrangements — retaining a larger share of premiums on Lemonade’s own balance sheet. The result is visible in the divergence between IFP growth (+32% YoY) and revenue growth (+70.6% YoY): the company is collecting the same premium but keeping far more of it. This is not financial engineering — it is the reward for having built a genuinely better underwriting model.
The Quarter Lemonade Has Been Building Toward
When Lemonade went public in July 2020 at $29 per share and promptly surged to $183, the market was pricing in a story of radical reinvention: an AI-native insurer that would displace the legacy carriers through superior data, lower costs, and a business model that aligned company incentives with customer outcomes. Then came the losses, the runaway loss ratios, the macro reset of growth valuations, and years of skepticism from investors who wondered whether the AI-native thesis would ever translate into actual financial results.
Q1 2026 is the answer to that question, and it is a resoundingly affirmative one. Revenue of $258 million grew 70.6% year over year — not a typo, not a one-time benefit — driven by a deliberate and successful strategic shift to retain more premium on Lemonade’s own balance sheet. Gross profit of $100 million, up 159% from approximately $38.6 million a year ago, represents the first time Lemonade’s underwriting economics are clearly visible at scale. A gross loss ratio of 62% — all-time low, and below the industry average for personal lines — is the statistical proof that the AI underwriting thesis is working. And an adjusted EBITDA loss of just $17 million, dramatically narrowed from $47 million in Q1 2025, shows a business moving toward the profitability inflection that management has promised for 2027.
The stock reacted accordingly. Shares rose approximately 5% in premarket trading following the release, representing a genuine beat reception rather than the sell-on-beat pattern that has plagued other growth names this earnings cycle. For Lemonade investors who have endured a multi-year holding period, this quarter validates the thesis. For those still on the sidelines, it raises the stakes: the window for skepticism about the fundamental business is narrowing.
Revenue: Reinsurance Strategy Meets Operating Leverage
To understand why Lemonade’s revenue grew 70.6% year over year while its in-force premium grew only 32%, you need to understand the company’s evolving relationship with its reinsurance partners — and why that relationship shift is the single most important driver of Lemonade’s financial transformation.
Lemonade’s revenue is primarily composed of gross premiums earned, net of amounts ceded to reinsurers. In the company’s early years, Lemonade ceded the vast majority of its premium to quota share reinsurance partners — in some periods, upwards of 75–80% of every premium dollar collected was immediately passed on to reinsurers. This kept Lemonade’s net exposure low during a period when its loss ratio was uncertain and its actuarial track record was short, but it also dramatically compressed the revenue that showed up on the income statement. The company was collecting the premium but booking only a fraction as revenue.
As Lemonade’s AI-driven pricing models have improved, its gross loss ratios have declined steadily to the current all-time low of 62%. That improvement gave management the actuarial confidence to renegotiate cession arrangements — retaining a larger share of premiums on Lemonade’s own balance sheet. The result is visible in the divergence between IFP growth (+32% YoY) and revenue growth (+70.6% YoY): the company is collecting the same premium but keeping far more of it. This is not financial engineering — it is the reward for having built a genuinely better underwriting model.
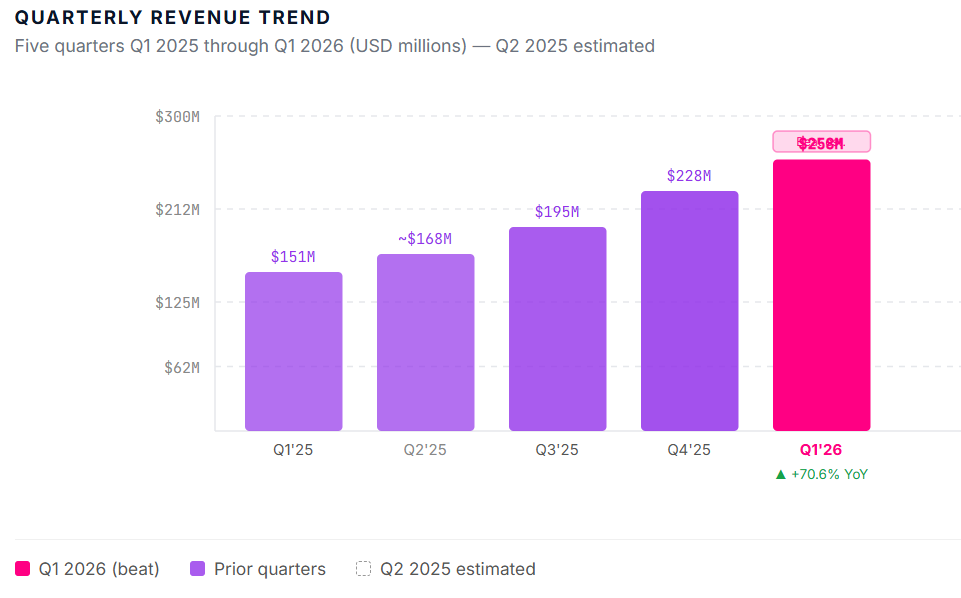
The sequential revenue trajectory is equally telling. From $151 million in Q1 2025 to approximately $168 million in Q2, $195 million in Q3, $228 million in Q4 — each quarter compounding on the last — and now $258 million in Q1 2026. This is a business running a quarterly revenue acceleration script, not a business cycling around a stable mean. The full-year 2026 guidance of approximately $1.20 billion in revenue implies this trajectory continues: sequential quarterly revenue in the $295–310 million range by Q4 2026 to hit the annual target.
The 62% Gross Loss Ratio: Why This Number Changes Everything
In insurance, the loss ratio is the foundational metric — it tells you what fraction of premiums collected is paid out in claims. A loss ratio above 100% means an insurer literally loses money on every dollar of premium it writes. Legacy carriers in personal lines (homeowners, auto, renters) have historically operated with gross loss ratios in the 65–80% range, with additional expense ratios layered on top. An insurer generating sustainable economics needs a combined ratio (losses plus expenses) below 100%.
Lemonade’s gross loss ratio of 62% in Q1 2026 is not just a Lemonade record — it is genuinely competitive with the best underwriters in the industry. When combined with improving operating leverage on the expense side, the combined ratio is approaching the threshold at which the underlying insurance economics become self-sustaining. The structural improvement over time has been remarkable: early in Lemonade’s history, loss ratios regularly exceeded 75-80%, reflecting the adverse selection risk inherent in a new insurer with limited actuarial history and suboptimal pricing precision. That era is clearly behind the company.
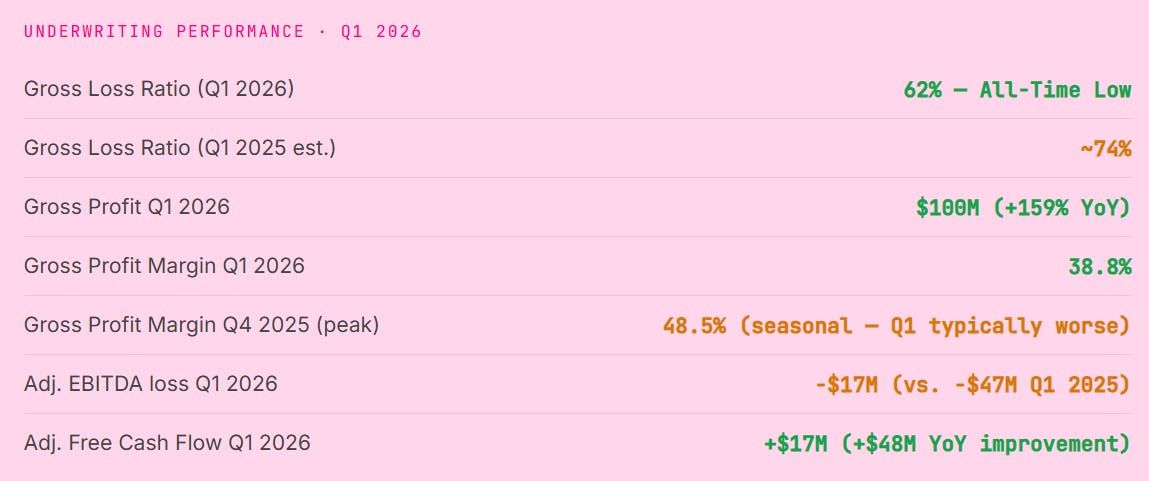
One important nuance: the gross profit margin in Q1 2026 (38.8%) is lower than Q4 2025’s 48.5%. This is not a step backward — it is the well-understood seasonality of the insurance business. Q1 tends to carry higher claims activity due to winter weather events: freeze damage, burst pipes, ice storms, and winter auto incidents all cluster in the first calendar quarter. The year-over-year comparison is the correct frame: Q1 2025 gross profit margin was approximately 25.6%; Q1 2026 was 38.8%. That 1,300+ basis point improvement in a single year represents genuine underwriting progress, not seasonal noise.
The adjusted free cash flow of +$17 million in Q1 2026 — compared to approximately -$31 million in Q1 2025 — is perhaps the most underappreciated metric in this print. It means that for the first time, Lemonade is generating operational cash flow after capital expenditures in its peak seasonal expense quarter. A business that produces positive cash flow in Q1 will almost certainly produce substantially more in Q2–Q4, when claims seasonality normalizes. This is the early signature of the cash flow profile of a self-sustaining insurance business.
Five Products, One Platform: The Portfolio Maturing
Lemonade offers five distinct insurance products — renters, homeowners, pet, car, and life — and the strategic arc across all five lines simultaneously is what separates this business from a single-product insurer. The diversification of the IFP base reduces correlated loss risk, enables cross-sell economics that dramatically lower customer acquisition costs, and creates a dataset across life events (buying a home, getting a pet, buying a car) that competitors with siloed product lines simply cannot access.
