

Meta's Strategic Triumph: Surging Ahead
Meta's Strategic Triumph: Surging Ahead
A Comprehensive Analysis of Meta's Financial Resilience, Innovative Edge, and Future Growth Trajectories in 2023


Financial Performance and Growth
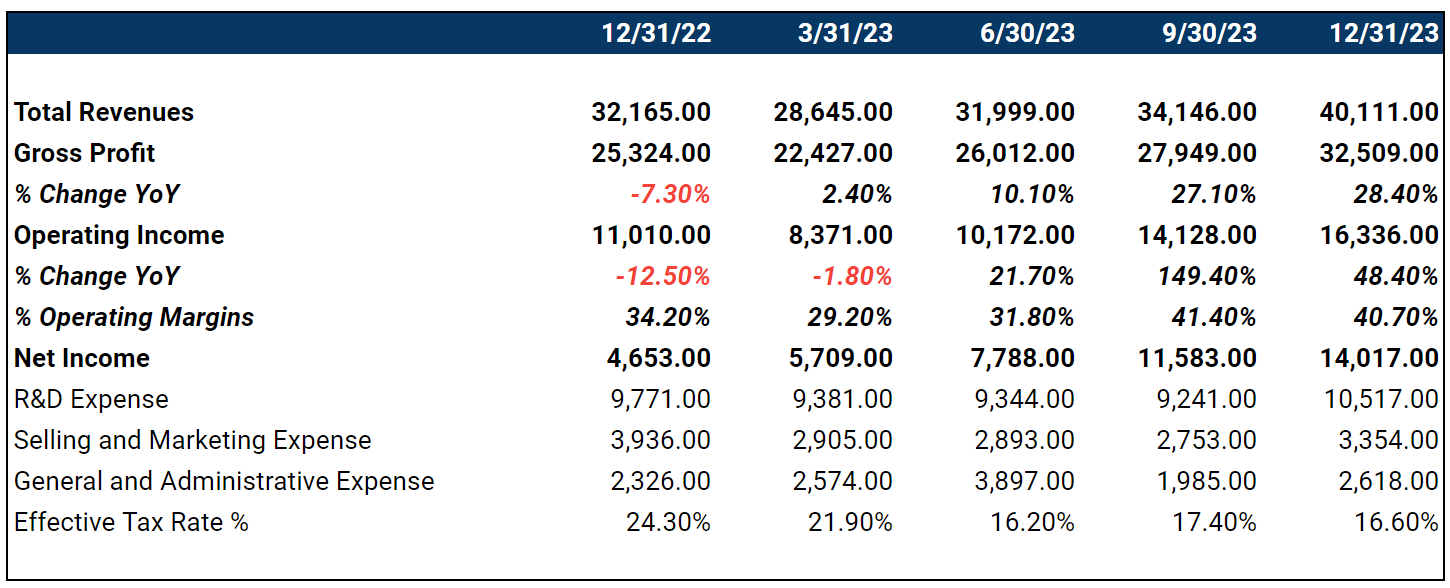
Q4 2023: Marked a significant year-over-year increase of 25% in revenue to $40.1 billion. Operating income soared to $16.4 billion with a 41% margin. Net income reached $14 billion, evidencing Meta's successful navigation of competitive and macroeconomic headwinds, alongside impactful ad revenue growth across key verticals.
Q3 2023: Demonstrated stronger growth with revenue hitting $34.1 billion, up 23% from the previous year, and operating income at $13.7 billion. The 40% operating margin reflected effective cost management and revenue growth, driven by robust ad sales and user engagement.
Q2 2023: Revealed a rebound with a 11% year-over-year revenue increase to $32 billion. Operating income rose to $9.4 billion, benefitting from a strategic emphasis on AI and ad monetization, particularly through Reels. A significant free cash flow of $11 billion underscored Meta's operational efficiency.
Q1 2023: Meta kicked off the year with a modest revenue increase of 3% year-over-year to $28.6 billion, underlining challenges yet showcasing resilience. Operating income at $7.2 billion and net income of $5.7 billion highlighted profitability amidst a focus on efficiency.
Q4 2022: The year prior concluded with a decrease in revenue by 4% year-over-year to $32.2 billion, attributing to increased expenses and operational challenges. Operating income was $6.4 billion, highlighting the early impact of Meta's efficiency and restructuring efforts.
Next Quarters Estimates:

Market Data:
52 Week High: $485.96
52 Week Low: $167.66
Avg. 3 Month Volume: 17.58 MM
5 Yr Beta: 1.22
Short Interest: 1.0%
Efficiency:
LTM Gross Margin: 80.7%
LTM EBIT Margin: 36.3%
LTM ROA: 14.7%
LTM ROE: 28.0%
LTM ROIC: 25.6%
Valuation:
Street Target Price: $478.71
NTM EV/Revenues: 7.48x
NTM EV/EBITDA: 12.96x
NTM P/E: 24.12x
NTM MC/FCF: 26.13x
LTM EV/Revenues: 8.77x
Capital Structure:
Market Cap (MM): $1,210,941.93
Enterprise Value (MM): $1,183,462.93
Shares Outstanding: 2,549.41 MM
LTM Net Debt (MM): $(27,479.00)
LTM Net Debt/EBITDA: (0.44x)
Growth:
Fwd 2-Yr Rev. CAGR: 14.3%
Fwd 2-Yr EBITDA CAGR: 21.4%
Fwd 2-Yr EPS CAGR: 23.6%
Last 3-Yr Rev. CAGR: 16.2%
Last 3-Yr EBITDA CAGR: 16.0%
Last 3-Yr EPS CAGR: 13.8%
Valuation:
LTM EV/Gross Profit: 10.87x
LTM P/E: 31.94x
LTM P/BV: 7.94x
LTM P/NCAV: 140.15x
Return Ratios:
Return on Assets %: 14.7%
Return on Capital %: 25.6%
Return On Equity %: 28.0%
Return on Common Equity %: 28.0%
Margin Analysis:
Gross Profit Margin %: 80.7%
SG&A Margin %: 17.0%
EBITDA Margin %: 44.6%
EBITA Margin %: 36.4%
EBIT Margin %: 36.3%
Income From Continuing Operations Margin %: 29.0%
Net Income Margin %: 29.0%
Normalized Net Income Margin %: 23.1%
Net Avail. For Common Margin %: 29.0%
Levered Free Cash Flow Margin %: 23.5%
Unlevered Free Cash Flow Margin %: 23.7%
Asset Turnover:
Asset Turnover: 0.59x
Fixed Assets Turnover: 1.34x
Receivables Turnover: 9.10x
Working Capital Turnover: 2.53x
Short Term Liquidity:
Current Ratio: 2.67x
Quick Ratio: 2.55x
Dividend Yield %: 0.4%
Op Cash Flow to Current Liab: 2.23x
Efficiency and Growth Strategy
Across 2023: Meta emphasized a "year of efficiency," focusing on operational streamlining and financial stability. Efforts included restructuring to a leaner organizational framework, enhancing execution, and innovating within AI and the metaverse domains. These moves aimed at creating a nimble, more efficient operation poised for long-term ambitions.
Q4 2022: Initiated a strong efficiency focus, aiming to streamline operations and reduce costs. This included flattening the organization and enhancing productivity through AI tools, setting the stage for the forthcoming year's efficiency narrative.
Keep reading with a 7-day free trial
Subscribe to LongYield to keep reading this post and get 7 days of free access to the full post archives.