
SOFI's Financial Performance: An In-Depth Analysis of Recent Quarters and Future Prospects
Examining SOFI's Steady Progress and Strategic Direction in the Financial Services Industry


Financial Performance
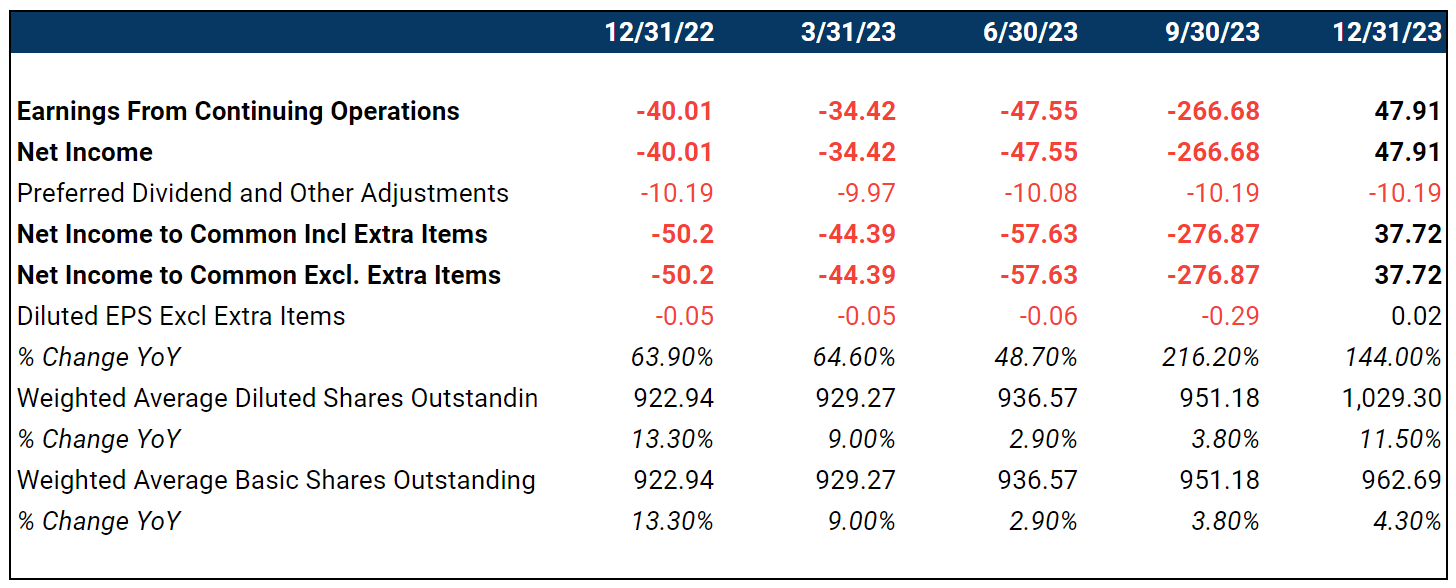
Q4 2023
Adjusted Net Revenue: $594 million (+34% YoY)
Adjusted EBITDA: $181 million
GAAP Net Income: Achieved profitability
Consolidated EBITDA Margin: 30%
Q3 2023
Adjusted Net Revenue: $531 million (+27% YoY)
Adjusted EBITDA: $98 million
Incremental Margin: 48%
Consolidated Margin: 18%
Q2 2023
Adjusted Net Revenue: $489 million (+37% YoY)
Adjusted EBITDA: Nearly $77 million
GAAP Net Loss: $48 million
Incremental GAAP Net Income Margin: 36%
Q1 2023
Adjusted Net Revenue: $460 million (+43% YoY)
Adjusted EBITDA: Nearly $76 million
GAAP Net Loss: $34 million
Incremental GAAP Net Income Margin: 54%
Q4 2022
Adjusted Net Revenue: $443 million (+58% YoY)
Adjusted EBITDA: $70 million
GAAP Net Loss: $40 million
Incremental GAAP Net Income Margin: 42%
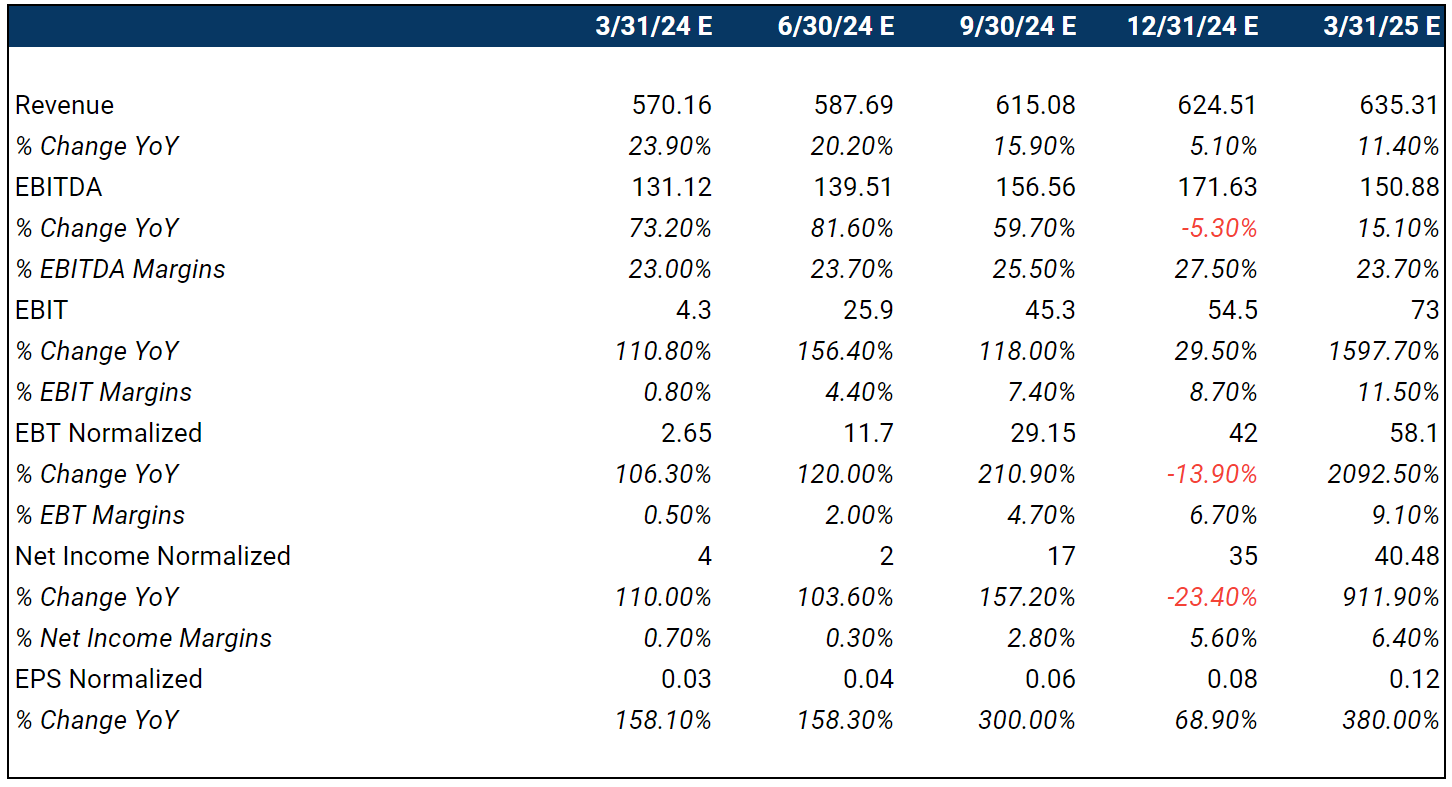
Estimates for Future Quarters:
Keep reading with a 7-day free trial
Subscribe to LongYield to keep reading this post and get 7 days of free access to the full post archives.