
Super Micro: The Margin That Blinked


server maker missed on revenue, cleared the EPS bar on a one-time, mix-driven gross margin spike, and handed the Street a fiscal 2027 guide so large it dares you to believe it. The durable bullish signal is the guidance and the backlog, not Q4 profitability: management already guides next quarter's margin back toward the low double digits. The real question is whether a $60 billion order book, not a 17.5% margin, survives an unfinished audit and an open export-control investigation.

01 / The Print In One Breath
A revenue miss dressed as a blowout
Super Micro Computer closed its fiscal year on June 30 and reported the quarter after the bell on Tuesday, August 11, 2026. This is the fiscal Q4 and full-year FY2026 print. On the two headline lines the market cared about most, the company split the decision: net sales of $11.1 billion landed near the low end of its own guidance and a few points below the roughly $11.5 billion analysts were modeling, while non-GAAP diluted EPS of $1.70 ran far past the ~$0.96 non-GAAP Street estimate (GAAP diluted EPS was $1.62). The reconciling item between a soft top line and a strong bottom line was gross margin, which the company reported at 17.5% on a GAAP basis, up from 9.9% the prior quarter (Q3 FY2026, the sequential figure) and 9.5% in the year-ago quarter. As Section 04 argues, that margin looks like a one-time, mix-driven event rather than a new baseline: management guides it back toward the low double digits next quarter.
The stock rose roughly 8.5% in the after-hours session. Almost none of that move was about the June quarter. It was about the guide: management framed fiscal 2027 revenue at $65 billion to $72 billion against a Street sitting near $52.5 billion, and first-quarter revenue at $14.5 billion to $15.5 billion versus a consensus closer to $11.7 billion. Layered on top was a claim of more than $60 billion in new orders booked in the June quarter alone and a record backlog entering the new fiscal year.
Our job in this note is to separate three things that Super Micro presentations tend to blur together: what is hard reported data, what is guidance, and what is opinion. That discipline matters more here than at almost any other large-cap, because this is a company whose auditor resigned in 2024, whose co-founder was indicted in 2026, and whose current-quarter numbers, while these are the actual Q4 results and not the July 21 pre-announcement, remain unaudited pending the fiscal 2026 Form 10-K and an independent board investigation running in the background.
“We added several hundred enterprise and other customers in the past year, generated more than $60 billion in new orders, and booked record backlog entering fiscal 2027.”Charles Liang, Founder, President & CEO, Q4 FY2026 release
02 / Results vs Expectations
The scorecard
Consensus figures below are drawn from sell-side aggregates reported around the print and should be treated as approximate; Super Micro is heavily covered but estimate dispersion is wide given the company’s volatility. Reported figures are from the company’s Q4 FY2026 release. We flag the revenue line as a miss and the profitability and guidance lines as beats.
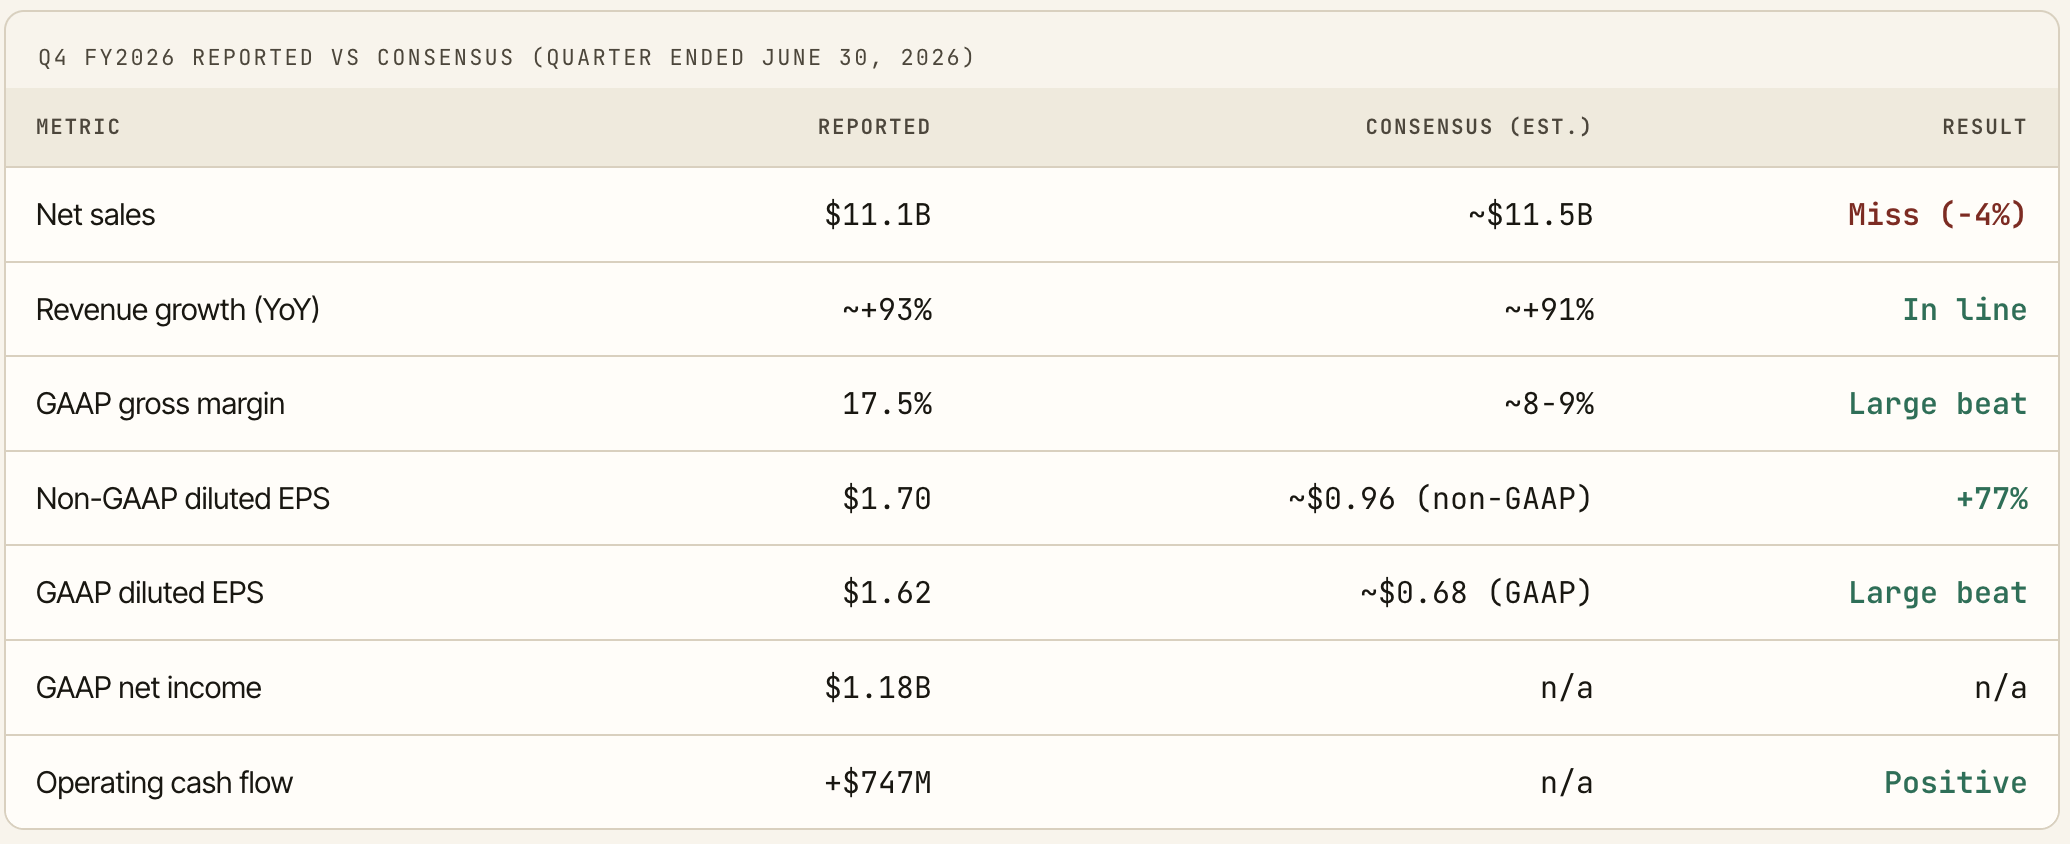
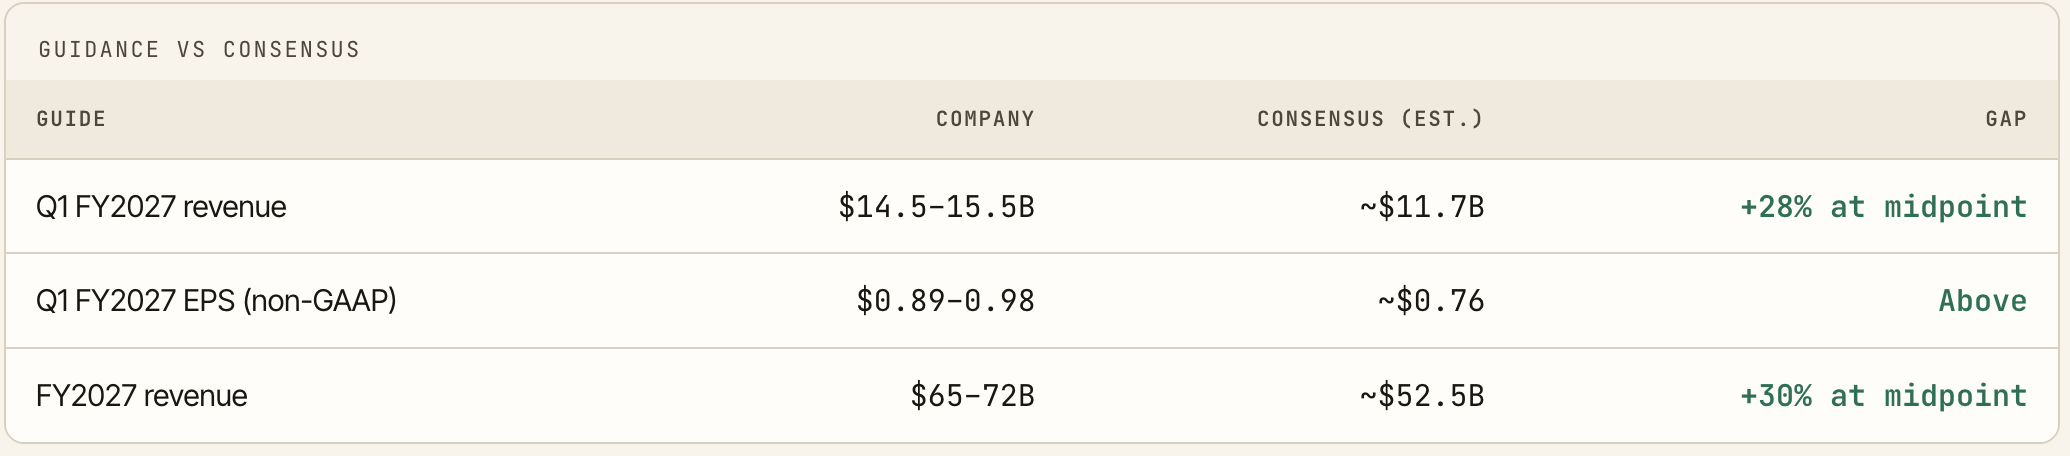
Read the fine printThe July 21 preliminary update already told the market three of these numbers: revenue near the low end, gross margin of 15% to 17%, and the $60 billion order figure. So the genuinely new information on August 11 was the exact margin (17.5%), the full FY2027 revenue guide, and the balance-sheet detail. The stock’s after-hours pop is therefore mostly a reaction to the FY2027 guide, not to the June quarter, which had been substantially pre-announced.
03 / The Revenue Line
Volatile by design, lumpy by customer
The quarter-to-quarter path tells the real story better than any full-year figure. Super Micro’s revenue swung from $5.0 billion in the September 2025 quarter to $12.7 billion in December, back to $10.2 billion in March and $11.1 billion in June. That is not a smoothly compounding business. It is a build-to-order integrator whose revenue recognition tracks GPU allocation, large customer deployment schedules, and product transitions (the Hopper-to-Blackwell handoff, then the Blackwell Ultra GB300 ramp).
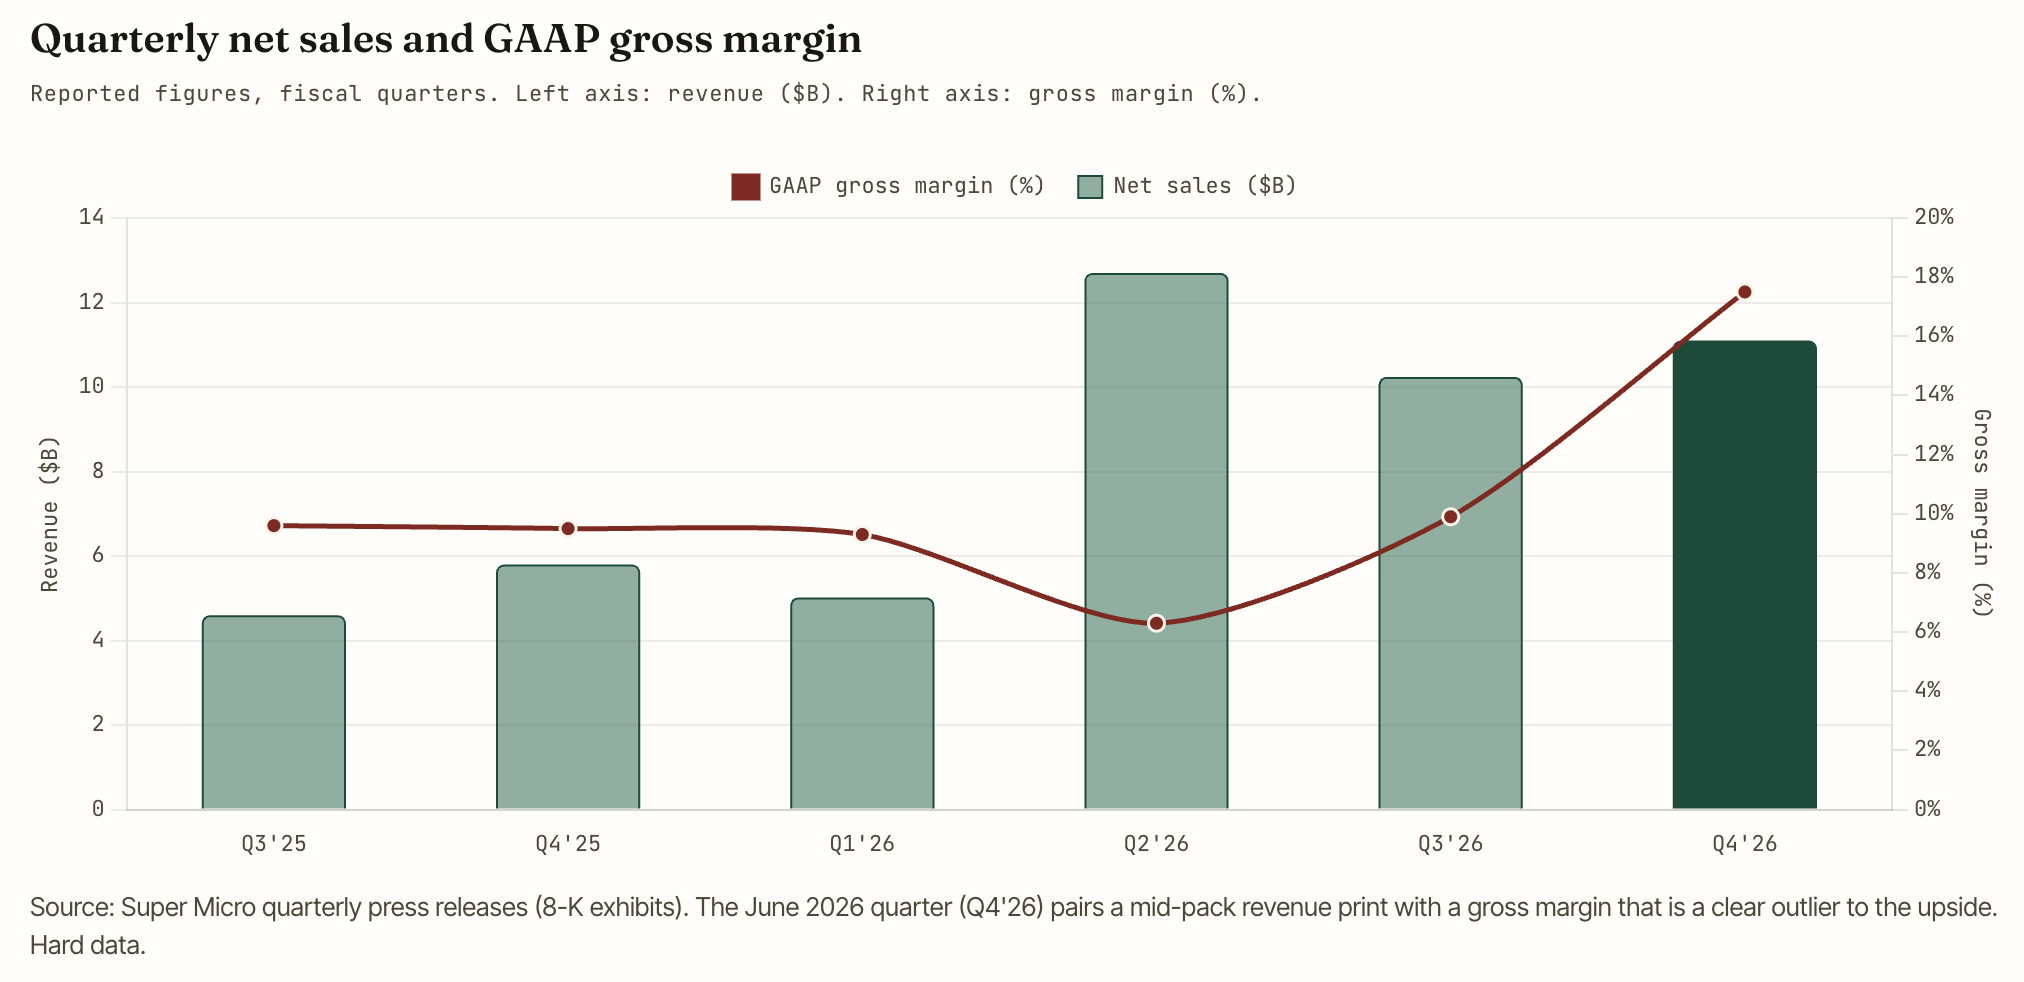
Note the shape: the two largest revenue quarters of the year (December’s $12.7 billion and June’s $11.1 billion) sat at opposite ends of the margin spectrum, 6.3% and 17.5% respectively. Revenue scale and profitability are decoupled here because mix (which customers, which products, what stage of a product cycle) drives margin far more than volume does.
04 / The Central Question
