
The Calm Before the Pump: How Global Fuel Inventories Entered Their Most Dangerous Chapter Since the 1970s
The 2026 Iran war and the closure of the Strait of Hormuz have triggered the largest oil supply disruption in the history of the modern energy market. The world's strategic buffers are draining


Section 01
Where We Stand: The Inventory Picture Has Never Looked Like This
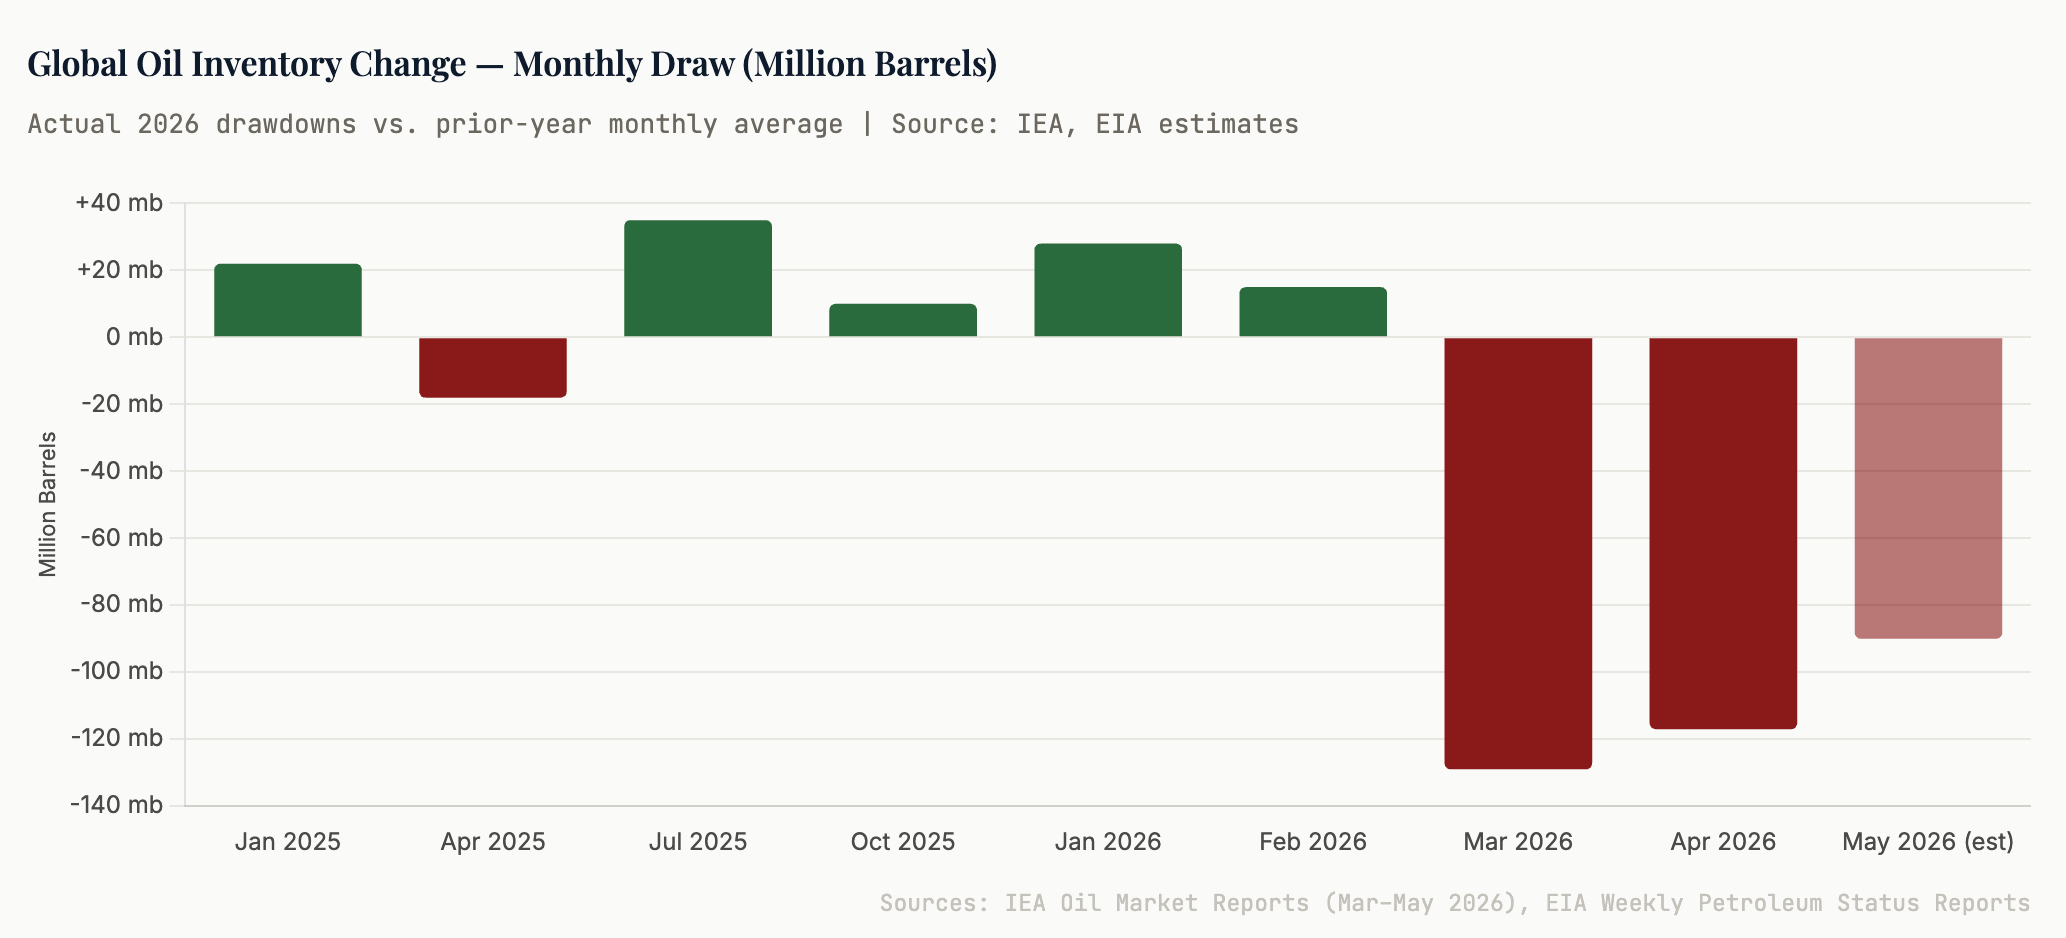
There is a number that energy traders do not like to say aloud: 246 million barrels. That is the combined net drawdown in global observable oil inventories across just two months — March and April of 2026. There is no comparable peacetime precedent in the modern era of energy markets. The IEA has called it precisely that: the largest supply disruption in the history of the global oil market.
To understand how we arrived here, it is necessary to separate the before from the after. Before February 28, 2026, the world’s oil inventory picture looked, on the surface, reasonably comfortable. Global observed inventories of crude and products were assessed at more than 8.2 billion barrels as recently as early 2026 — the highest reading since February 2021. OECD commercial stocks sat near five-year averages. The United States held roughly 452 to 457 million barrels of commercial crude. Strategic reserves across member countries of the International Energy Agency totalled approximately 1.25 billion barrels in government-held emergency stocks, with a further 600 million barrels held under government obligation by commercial entities.
Days-of-demand coverage, the benchmark metric that analysts use to measure whether the world is sitting on a comfortable cushion or teetering on the edge of scarcity, appeared adequate. OECD coverage was broadly in line with historical norms — roughly 57 to 60 days, above the informal danger threshold of 55 days that tends to trigger market anxiety. The consensus heading into 2026, published in forecast after forecast from the IEA, OPEC, and the EIA, was of a market in modest surplus, with OPEC+ gradual production increases unwinding cuts at a controlled pace and demand growth moderate but steady. The tariff turbulence of late 2025 had created some headwinds, but the market had absorbed them.
That consensus was obliterated in a matter of weeks.
On February 28, 2026, the United States and Israel launched coordinated strikes against Iran under the operational designation Epic Fury, targeting nuclear sites, missile infrastructure, and Iranian leadership. Supreme Leader Ali Khamenei was killed. In retaliation, Iran launched extensive missile and drone attacks against Israel, US military installations, and US-allied Gulf states. On March 4, Iranian authorities formally announced what had already become operationally true: the Strait of Hormuz was closed. The Iranian Revolutionary Guard Corps issued explicit warnings forbidding passage, boarded and attacked merchant vessels, and laid sea mines across the strait’s navigation channels.
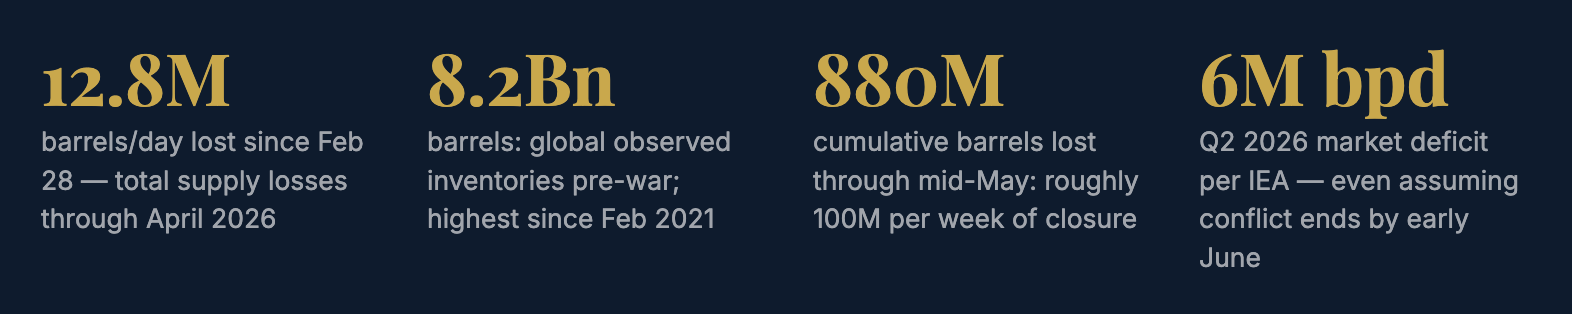
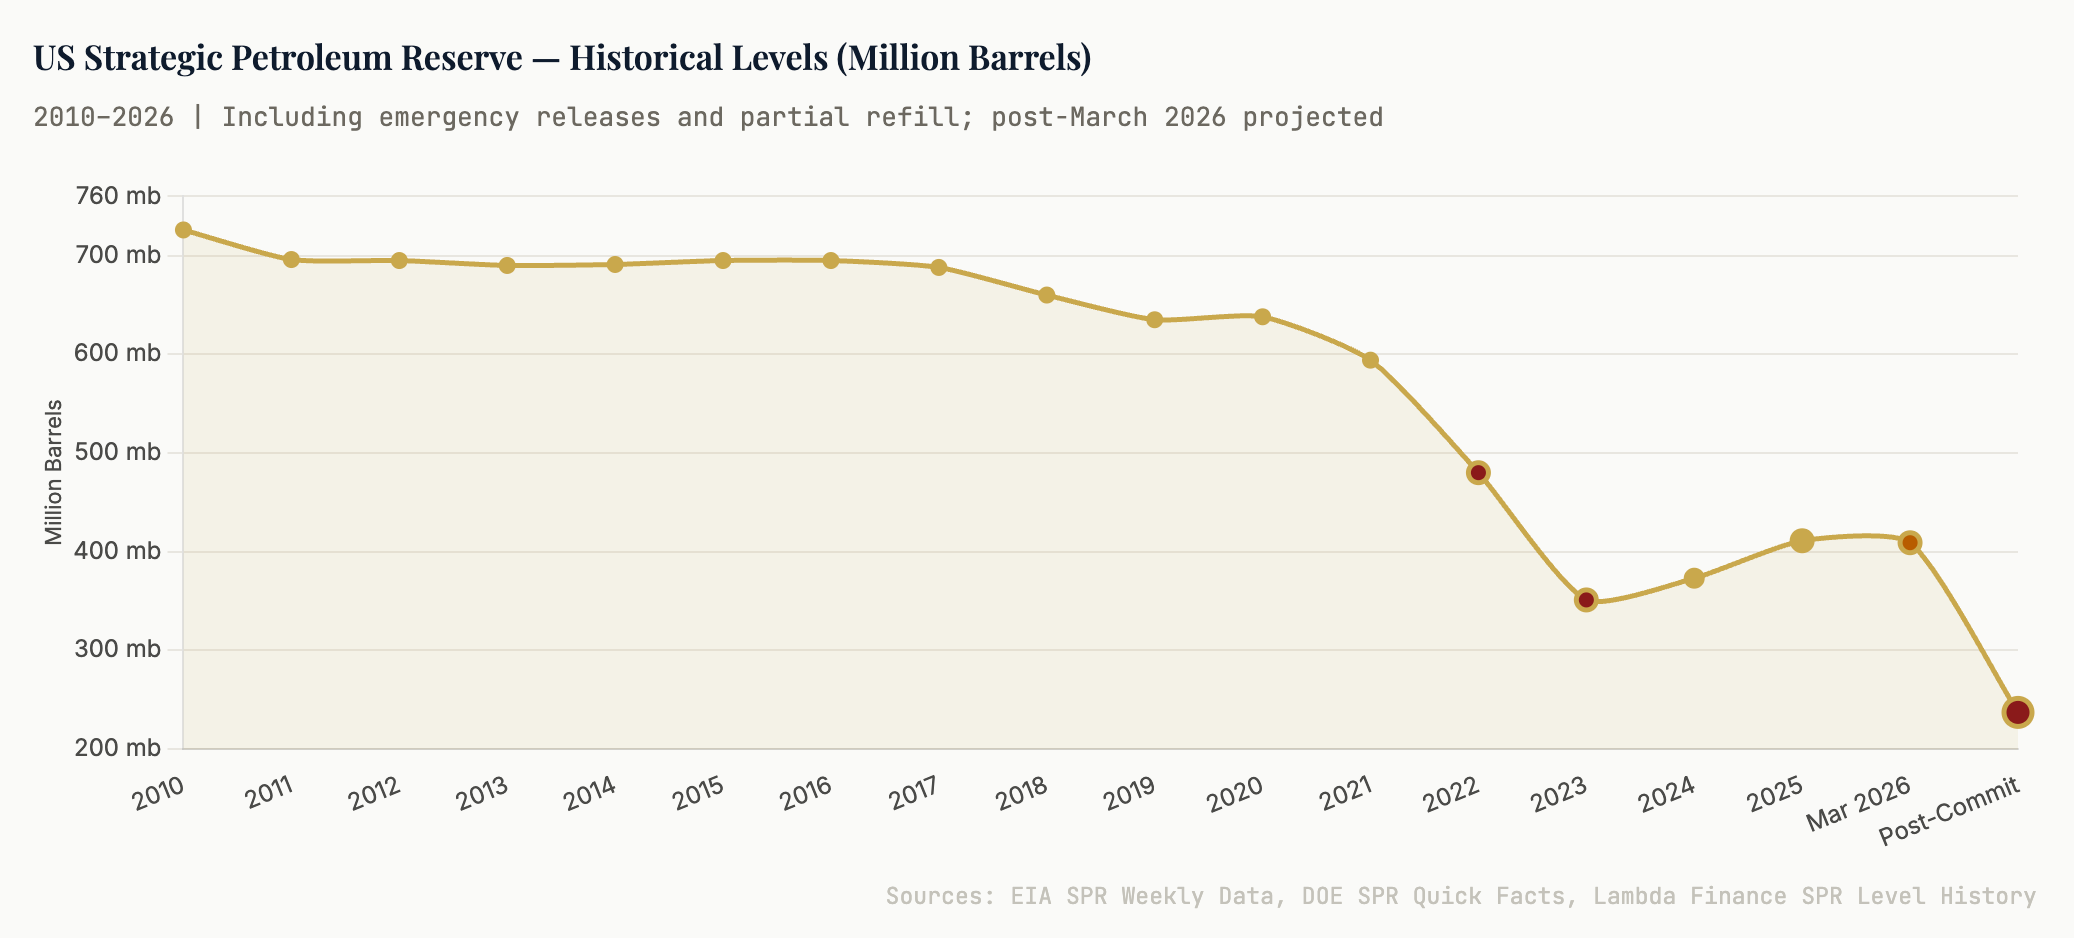
The closure of the Strait of Hormuz — through which approximately 25 percent of the world’s seaborne oil trade and 20 percent of global LNG trade normally transits — instantly removed enormous volumes from global supply. Qatar’s LNG exports, representing one-fifth of global liquefied natural gas trade, were stranded entirely as QatarEnergy declared force majeure. Gulf output dropped roughly 14.4 million barrels per day below pre-war levels at the peak of disruption. The cumulative supply loss has been staggering: by mid-May 2026, the running total stands at approximately 880 million barrels — more than the entire US Strategic Petroleum Reserve at its 2009 peak of 727 million barrels, wiped from the market in approximately ten weeks.
The surface-level inventory figures that looked adequate in January now serve as a painful reminder of how quickly the arithmetic of global energy security can change.
Section 02
The Cushion That Bought Us Time: The Pre-War Energy Balance
The world did not enter 2026 underprepared in the conventional sense. A series of factors had conspired to create a more comfortable supply buffer than at almost any point in the prior three years — a fact that has made the severity of the subsequent shock all the more jarring.
US crude production had reached record levels by late 2025, averaging approximately 13.59 million barrels per day — a figure that represented a 2.7 percent annual increase and cemented America’s position as the world’s largest oil producer by a considerable margin. The Permian basin alone was producing roughly 6.6 million barrels per day, accounting for nearly half of total domestic output. EIA forecasts entering 2026 projected production would remain approximately flat at 13.6 million barrels per day through the year, a posture consistent with the disciplined capital allocation that public oil companies had adopted since the shale boom-and-bust cycle of 2014 to 2016.
Simultaneously, OPEC+ had been holding production cuts in place through much of 2024 and 2025, meaning that significant latent spare capacity existed within the cartel. Saudi Arabia alone maintained an estimated 2 to 3 million barrels per day of spare production capability. The UAE, which had been chafing at its OPEC+ quotas for years — a frustration that would eventually catalyse its dramatic exit from the organisation on May 1, 2026 — was producing roughly 1 million barrels per day below what it was technically capable of delivering. On paper, OPEC+ spare capacity of 4 to 5 million barrels per day represented a meaningful global buffer against supply disruptions.
The demand side also contributed to the pre-war comfort. Chinese oil demand, while growing, had been softer than post-COVID recovery optimists had anticipated. The country’s pivot toward electric vehicles — EVs now account for roughly 40 percent of new domestic car sales — had meaningfully slowed the growth trajectory for transport fuel. The winter of 2025 to 2026 across the northern hemisphere was mild relative to historical averages, reducing heating fuel draws. The Biden-era drawdown of 180 million barrels from the US Strategic Petroleum Reserve between 2022 and 2023 had been partially offset by a partial refill programme in late 2024 and early 2025, bringing the SPR to approximately 411 million barrels by year-end 2025.
“The market entered 2026 in a position that, by most standard metrics, looked like a moderate surplus. OPEC+ had latent capacity. The US was pumping at records. Chinese demand was below the bullish forecasts. If the pre-war consensus had held, we would be writing about falling prices and oversupply. Instead, we are writing about the largest disruption in the history of the oil market.”
— Energy Policy Analysis, Dallas Federal Reserve, March 2026
The tariff shocks of late 2025 and early 2026 — which had been expected to dampen global trade activity and by extension industrial fuel demand — had introduced demand-side headwinds that reinforced the comfortable price environment. Brent crude had hovered in the low to mid $70s through January 2026, and many forecasters were projecting further weakness into mid-year. The macro outlook was one of careful management rather than crisis. The IEA’s January 2026 oil market report referenced “normalisation of economic conditions after tariff turbulence” and projected modest demand growth alongside a gradual OPEC+ unwinding of cuts.
It is worth pausing to appreciate the speed with which that normalisation narrative collapsed. On February 27, Brent closed at approximately $73 a barrel. By March 8, it had crossed $100 for the first time in four years. By the peak, it would reach $126. Within eight days of the war beginning, the entire pre-war analytical framework had been rendered irrelevant. The cushion was not large enough. It was never going to be large enough for what came next.
Section 03
Operation Epic Fury and the Hormuz Closure: A Crisis-by-Crisis Timeline
To understand the current state of global fuel inventories, it is necessary to trace the precise sequence of events that transformed a comfortable pre-war balance into the most acute energy security crisis since the Arab oil embargo of 1973.
Feb 28, 2026
Operation Epic Fury begins. The United States and Israel launch coordinated airstrikes against Iran targeting nuclear facilities, ballistic missile infrastructure, IRGC command structures, and regime leadership. Supreme Leader Ali Khamenei is killed. Brent crude opens that Monday morning up 6 percent. US commercial crude inventories of ~457 million barrels suddenly look entirely inadequate as a buffer against what is about to unfold.
Mar 1–3, 2026
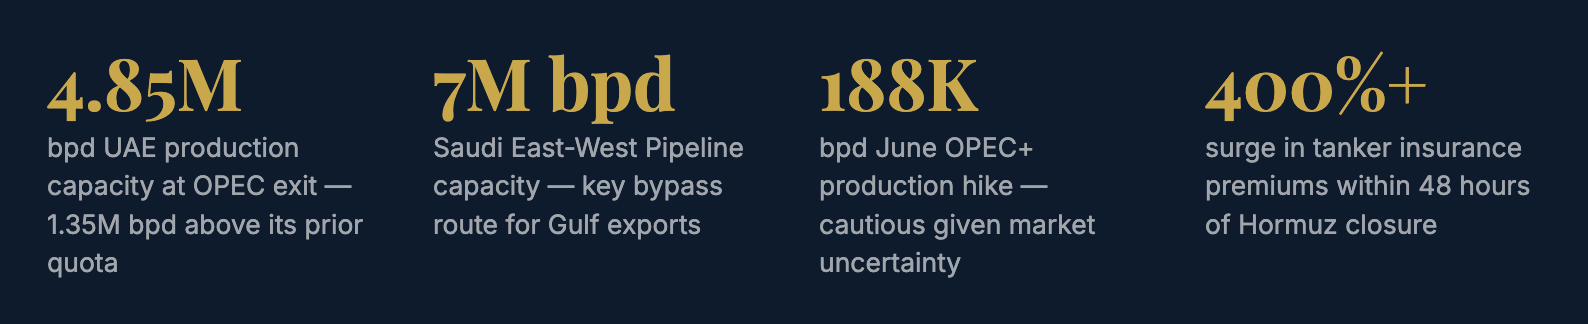
Iranian retaliation begins. Iran fires ballistic missiles at Israeli cities, US bases in the Gulf, and allied infrastructure across the GCC region. The UAE — simultaneously a target of Iranian attacks and a central node of global energy logistics — begins rerouting limited oil exports via its Habshan-Fujairah pipeline, bypassing the strait. Insurance premiums for vessels attempting Gulf transit surge over 400 percent within 48 hours.
Mar 4, 2026
Strait of Hormuz formally closed. Iran declares the strait closed to all commercial traffic. The IRGC boards and seizes two merchant vessels attempting passage. Sea mines are laid. QatarEnergy immediately declares force majeure on all LNG exports — removing roughly one-fifth of global LNG supply from the market in a single morning. Brent closes above $106. Dutch TTF natural gas prices surge 20 percent on the day.
Mar 9, 2026
IEA emergency meeting — largest reserve release in history. Finance ministers from the G7 and IEA leadership convene an emergency session authorising the release of 300 to 400 million barrels from global strategic petroleum reserves — the largest coordinated emergency action in the IEA’s 52-year history. The US commits 172 million barrels from the SPR. The intervention is intended to bridge the market through an assumed short disruption. This assumption will prove optimistic.
Mar 11, 2026
Brent crosses $120. IEA member countries unanimously confirm the 400-million-barrel collective release. Global crude prices reach $126/barrel by mid-March — the highest level since 2022. Panic buying and fuel hoarding break out across several Asian and European markets. California governors warn of four to six weeks of gasoline and diesel supply remaining under prolonged disruption scenarios.
Mar 18, 2026
Ras Laffan LNG complex struck. Iran targets Qatar’s Ras Laffan Industrial City LNG complex, causing an estimated 17 percent reduction in Qatar’s LNG production capacity. Engineers assess that full repair will require three to five years. The attack underscores that the energy disruption is not merely logistical — it is structural damage to physical infrastructure that cannot be reversed on the timeline of a ceasefire.
Apr 7–8, 2026
Ceasefire announced. President Trump announces on social media that Pakistan has brokered a two-week ceasefire. Iranian officials confirm Supreme Leader’s successor has approved the pause. Oil prices immediately pull back: WTI plunges below $84/barrel on April 17, settling near $80, as Iran’s foreign minister declares the strait open to all shipping traffic. Market relief is palpable but premature.
Apr 17–May 14, 2026
Fragile ceasefire — the strait remains operationally closed. Despite the formal ceasefire, commercial shipping has not normalised. Only 191 vessels crossed the Strait of Hormuz in the entire month of April. As of May 5, Windward Intelligence identifies 146 of 167 commercial vessels in the Hormuz area operating “dark” — with AIS transponders disabled. Trump launches Operation Project Freedom on May 4 to escort stranded vessels. Ceasefire talks remain stalled; Trump has rejected Iran’s counterproposals. As of May 12, Brent has recovered to $107.77 and WTI to $102.18 on renewed escalation fears.
⚠
Critical Market Context as of May 14, 2026The ceasefire remains on what Trump himself has described as “life support.” A 51.5% probability on Polymarket pegs WTI reaching $110/barrel before end of May 2026. Saudi Aramco CEO Amin Nasser stated on May 11 that oil markets will not normalise until 2027 if Hormuz disruption persists past mid-June. Every week of closure costs the global market approximately 100 million barrels of supply.
Section 04
The SPR Under Siege: How the World’s Emergency Reserves Are Being Spent
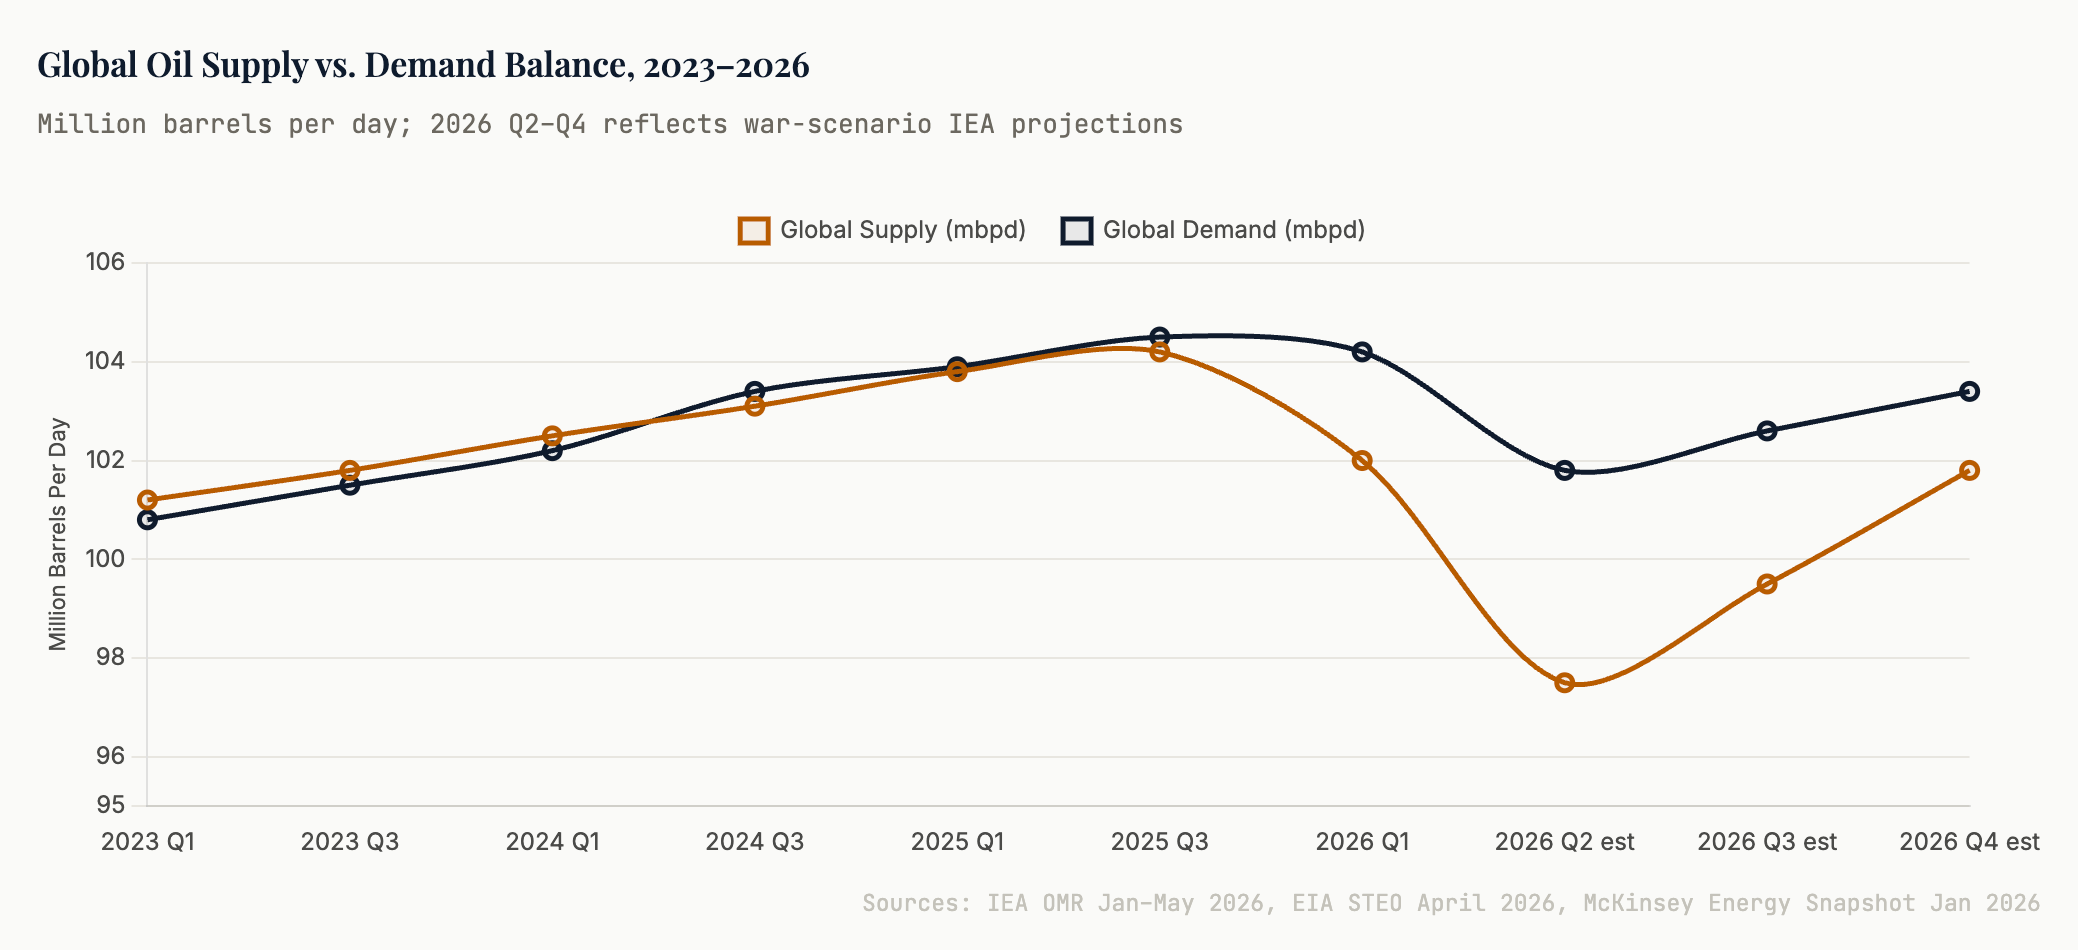
The Strategic Petroleum Reserve of the United States was designed for exactly this kind of crisis. It was built in the aftermath of the 1973 Arab oil embargo, under President Ford, to give America a buffer of months rather than weeks against sudden supply disruptions. Today, after the largest coordinated emergency release in IEA history and a decade of below-peak refills, that buffer is significantly thinner than the headline number suggests.
The US SPR entered 2026 at approximately 411 million barrels — a level that represented a partial recovery from the historic Biden-era drawdown of 180 million barrels conducted in 2022 and 2023 in response to the post-Ukraine oil price spike. At its 2009 peak, the SPR held 727 million barrels. By end-2025, it had recovered only roughly 100 million barrels from the post-2022 lows, leaving it 44 percent below peak capacity even before the current crisis began.
The March 2026 IEA coordinated action committed 172 million barrels from the US SPR as part of the 400-million-barrel global release. The Trump administration — which had campaigned on the rhetoric of refilling the SPR “to the top” — found that the budget constraints and procurement logistics of a large-scale refill had proven far more challenging in practice than the political promise suggested. The partial refill had been bought at prices in the $70 to $80 per barrel range; the emergency sale is now being made into a market where Brent trades above $100. The arithmetic of that reversal is unflattering.
Beyond the headline numbers, the composition and regional accessibility of SPR stocks matter enormously. The US reserve is stored across four salt cavern sites along the Gulf of America coast — Bryan Mound, Big Hill, West Hackberry, and Bayou Choctaw. These sites are designed primarily to feed Gulf Coast refineries processing medium to heavy crude grades. The light, tight crude flooding US markets from shale production does not simply substitute for the heavier grades arriving from the Middle East; refineries configured for heavy crude cannot simply switch feedstocks without significant cost and operational disruption. This is a structural vulnerability in the emergency infrastructure that the headline barrel count obscures.
“The Strategic Petroleum Reserve was built for a supply shock lasting months, not the kind of multi-year infrastructure disruption that a damaged Ras Laffan creates. We are spending our emergency insurance at a pace we cannot sustain, to bridge a gap that may not close on any timeline the market is currently pricing.”
— Seraph Energy Research, May 2026
The IEA’s coordinated release of 400 million barrels — drawn from member country reserves across the US, Europe, Japan, and Australia — represents roughly 25 to 30 percent of total IEA emergency stockpiles. This action has functioned as intended in the immediate term: it prevented a complete collapse of supply to key consumer markets during the acute phase of the disruption. But it has also significantly reduced the world’s available emergency buffer for any subsequent shock. If the ceasefire fails and full-scale conflict resumes, the remaining IEA stockpile will need to work considerably harder with considerably less material to deploy.
China’s situation merits separate consideration. Beijing entered the crisis with approximately 1.39 billion barrels in total storage as of early March 2026 — enough to cover roughly 120 days of net crude imports at 2025 levels. China has been drawing on those reserves steadily, even as it continued to receive limited Iranian crude flows through the strait (Iran managed to ship at least 11.7 million barrels of crude to China in the weeks after the war began, predominantly via vessels operating with disabled tracking). China’s crude imports fell 20 percent in April compared to the prior year, and Beijing has slashed imports by approximately a quarter from pre-war levels. Sustained at that pace, China’s strategic buffer would face meaningful pressure within 12 to 18 months.
Section 05
The OPEC+ Fracture: UAE Exit, Saudi Strategy, and a Cartel Under Strain
The geopolitical upheaval has simultaneously stressed and reshaped OPEC+ in ways that will have lasting consequences for the global energy architecture. The organisation that had served as the supply management backstop for the world oil market for nearly a decade has lost a major member, is confronting unprecedented disruptions to the production and export infrastructure of two of its most important producers, and is making decisions under conditions of extreme uncertainty.
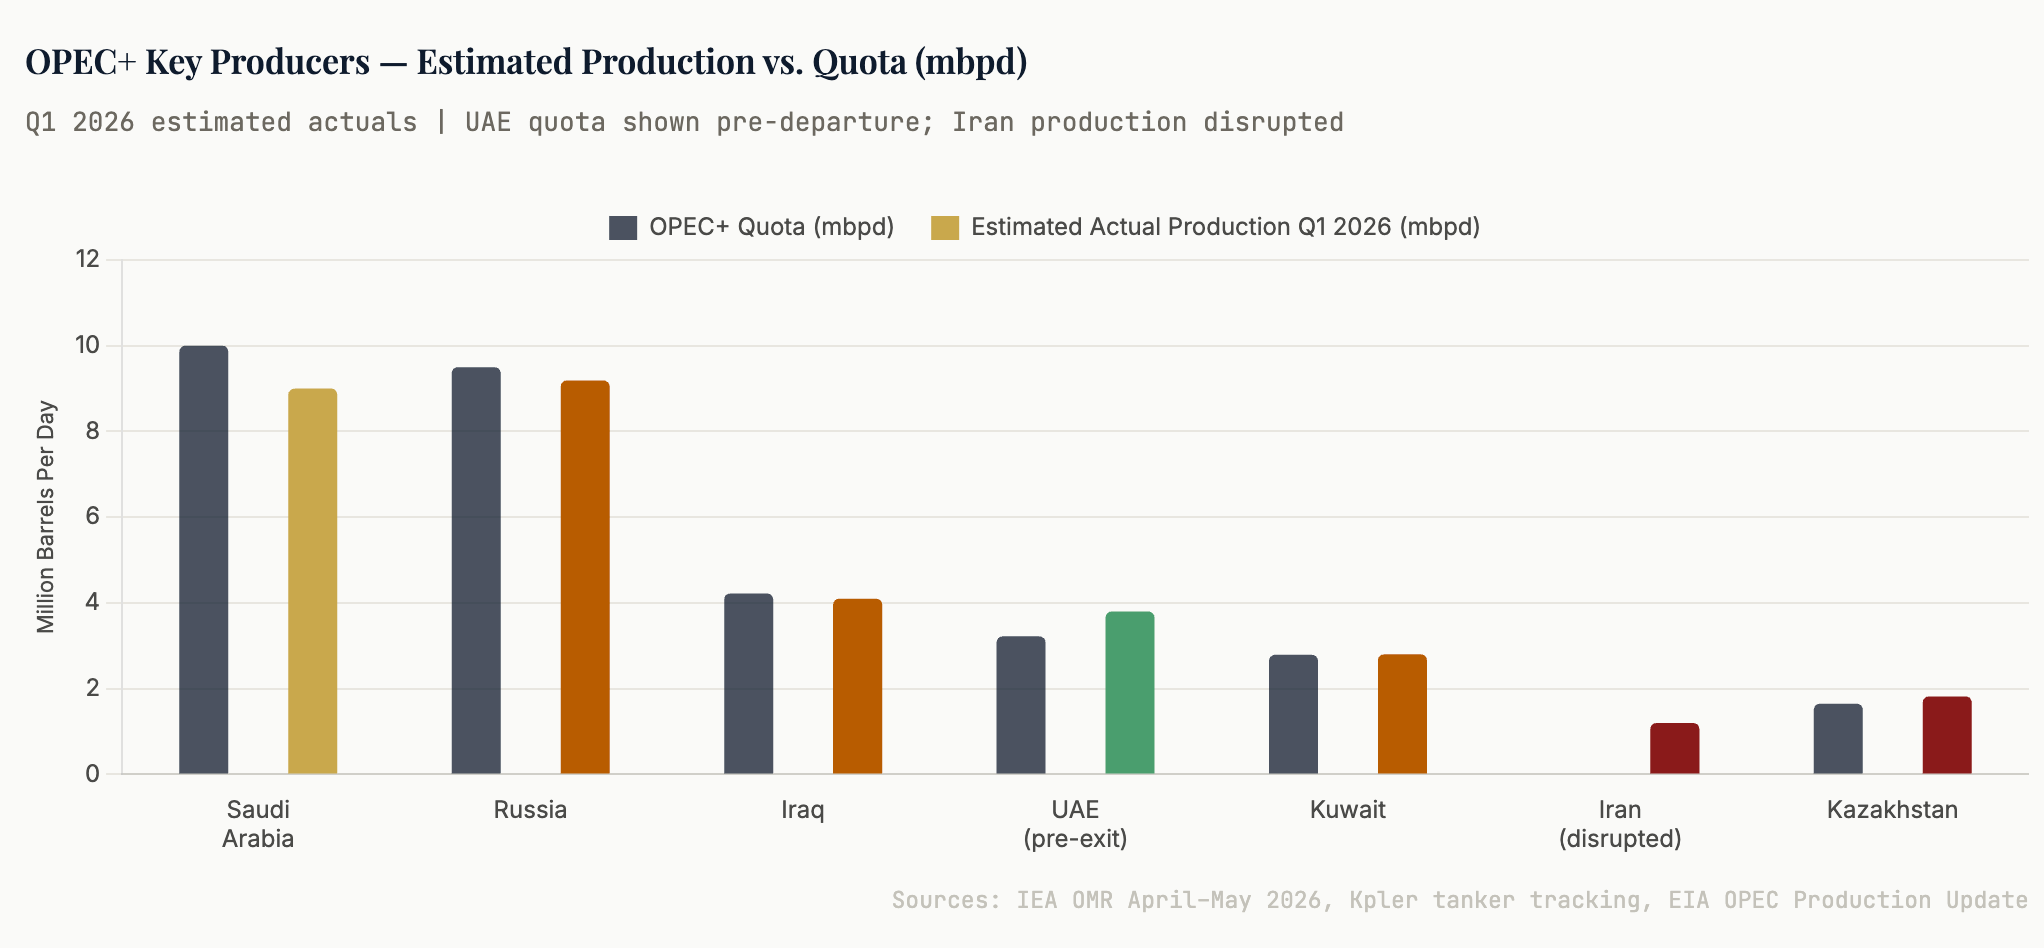
The UAE’s departure from OPEC on May 1, 2026 — effective after approximately 59 years of membership — was months in the making but precipitated by two distinct forces. The first was structural and longstanding: Abu Dhabi’s frustration with a production quota that left it with a gap of at least 1.35 million barrels per day between what it could technically produce and what OPEC permitted it to sell. The UAE had invested tens of billions of dollars in expanding ADNOC’s production capacity toward a target of 5 million barrels per day, and the OPEC+ quota framework was preventing it from monetising that investment. By 2026, the UAE’s production capacity stood at approximately 4.85 million barrels per day, yet its quota left it substantially constrained.
The second force was more visceral: Iran had been attacking UAE infrastructure with missiles and drones, targeting the very terminals and export facilities that OPEC membership was nominally designed to protect. The logic of constraining production to support prices while a fellow OPEC member launched military strikes against your energy infrastructure became untenable in both commercial and geopolitical terms. Abu Dhabi’s decision to exit was, in the end, simultaneously rational and inevitable.
OPEC+ has continued to function without the UAE, though the first meeting since the departure — held in May 2026 — approved a modest production increase of only 188,000 barrels per day for June, far below the pace of prior months. This caution reflects the genuine uncertainty about how much of the OPEC+ production landscape remains physically accessible. Iraq’s southern export terminals near Basra have faced infrastructure stress from conflict proximity. Saudi Arabia’s exports have been largely redirected through the East-West Pipeline — a roughly 750-mile system connecting eastern Saudi fields to the Red Sea port of Yanbu, with a design capacity of 7 million barrels per day — supplemented by very long Cape of Good Hope routing for Atlantic-bound cargoes that has added 14 to 18 days to transit times and driven shipping costs and insurance premiums to extraordinary levels.
Saudi Arabia’s fiscal position adds another layer of complexity to OPEC+ dynamics. The kingdom’s breakeven oil price — the budget-balancing price required to fund social spending and Vision 2030 programmes — is estimated at approximately $90 to $100 per barrel. At current Brent prices around $107, Saudi Arabia is operating comfortably above that threshold, but the price is elevated precisely because of a crisis that is simultaneously destroying global demand and shutting off Saudi export routes. The paradox is acute: high prices do not benefit a producer that cannot physically deliver barrels to market. Riyadh’s interests in the current crisis are therefore considerably more nuanced than simply supporting elevated prices.
Russia, meanwhile, continues to pump at approximately 9.19 million barrels per day of crude — a figure slightly below its OPEC+ quota but broadly consistent with the compliance narrative Moscow has maintained. Ukraine drone strikes on Lukoil’s Caspian offshore cluster caused temporary disruptions of 200,000 to 400,000 barrels per day in late 2025, but production has largely recovered. Russia has been opportunistically redirecting oil to Asian buyers — particularly China and India — as Western sanctions have continued to suppress European market access. The war in Ukraine remains a secondary variable in the energy calculus for 2026, overshadowed by the vastly larger Hormuz disruption.
Section 06
“Drill, Baby, Drill” Runs Into Geology and Economics
The Trump administration’s signature energy posture — “drill, baby, drill,” the promise to unleash American petroleum production as the solution to both domestic energy prices and global supply deficits — has collided with a set of physical, economic, and structural constraints that rhetoric cannot dissolve.
US crude production entered 2026 at record levels of approximately 13.59 million barrels per day, and the EIA forecast that output would remain roughly flat through the year at approximately 13.6 million barrels per day. The Permian basin — accounting for nearly half of all domestic production at roughly 6.3 to 6.6 million barrels per day — has been the engine of US shale dominance. The White House opened hundreds of millions of acres to oil and gas development and streamlined permitting processes. Diamondback Energy, the third-largest Permian operator, publicly declared it was adding fracking crews and drilling rigs. The administration pointed to these signals as evidence that America could produce its way out of the global supply shock.
The markets disagreed, and for good reason. A Federal Reserve Bank of Dallas survey of oil and gas executives conducted in April 2026 found that most respondents believed US production would remain flat or increase by less than 250,000 barrels per day this year because of the Iran war — enough to replace less than 3 percent of the 10 million barrels per day lost daily through the Hormuz closure. The fundamental constraints are unambiguous: shale wells decline rapidly, requiring relentless reinvestment simply to maintain production levels. The drillable inventory in the Permian’s core acreage has been substantially exploited by a decade of intensive development. New wells drilled in 2026 will be on average less productive per rig than those drilled in 2020. And the crude quality mismatch remains critical: US shale produces predominantly light, sweet grades that cannot directly substitute for the medium and heavy sour crudes that Middle Eastern producers and Gulf Coast refineries are configured to process.
There is also the economic calculus. Oil and gas executives, having lived through the trauma of 2015 and 2020, have adopted capital discipline as an almost religious commitment. They are not going to aggressively accelerate spending in response to a price spike that may prove temporary. The Dallas Fed survey confirmed exactly this: even with Brent above $100, operators are moving cautiously, skeptical that prices will remain elevated through the multi-year investment cycles that meaningful new production requires. The “drill, baby, drill” rhetoric is politically potent but operationally bounded by the hard mathematics of decline curves, refinery specifications, and investor expectations.
◆
The Refinery GapEven if US production were to surge, the refinery infrastructure to process it is under strain. US refinery capacity declined through multiple closures following the COVID demand collapse of 2020. Asian refinery utilisation has fallen below 50% at some Singapore facilities due to crude feedstock constraints. Asian refining throughput is projected to tumble in April and May as crude imports hit a 10-year low, curbing diesel and jet fuel output by at least 1 million barrels per day. The crude availability problem and the refining capacity problem are not the same problem — and solving the first does not automatically solve the second.
The broader point about US production’s role in the global supply balance deserves emphasis. America is, without question, a stabilising force in global energy markets. Record domestic production has provided genuine structural insulation against the kind of price shocks that the oil crises of 1973, 1979, and 1991 produced in an era of American import dependence. But America’s shale production is a cushion, not a cure. It is a supply-side buffer against incremental disruption. It is not a replacement for 20 percent of world oil trade that transits a now-militarised and partly mined strait in the Persian Gulf.
Section 07
The Demand Wildcard: Destruction, Rationing, and the Diesel Problem
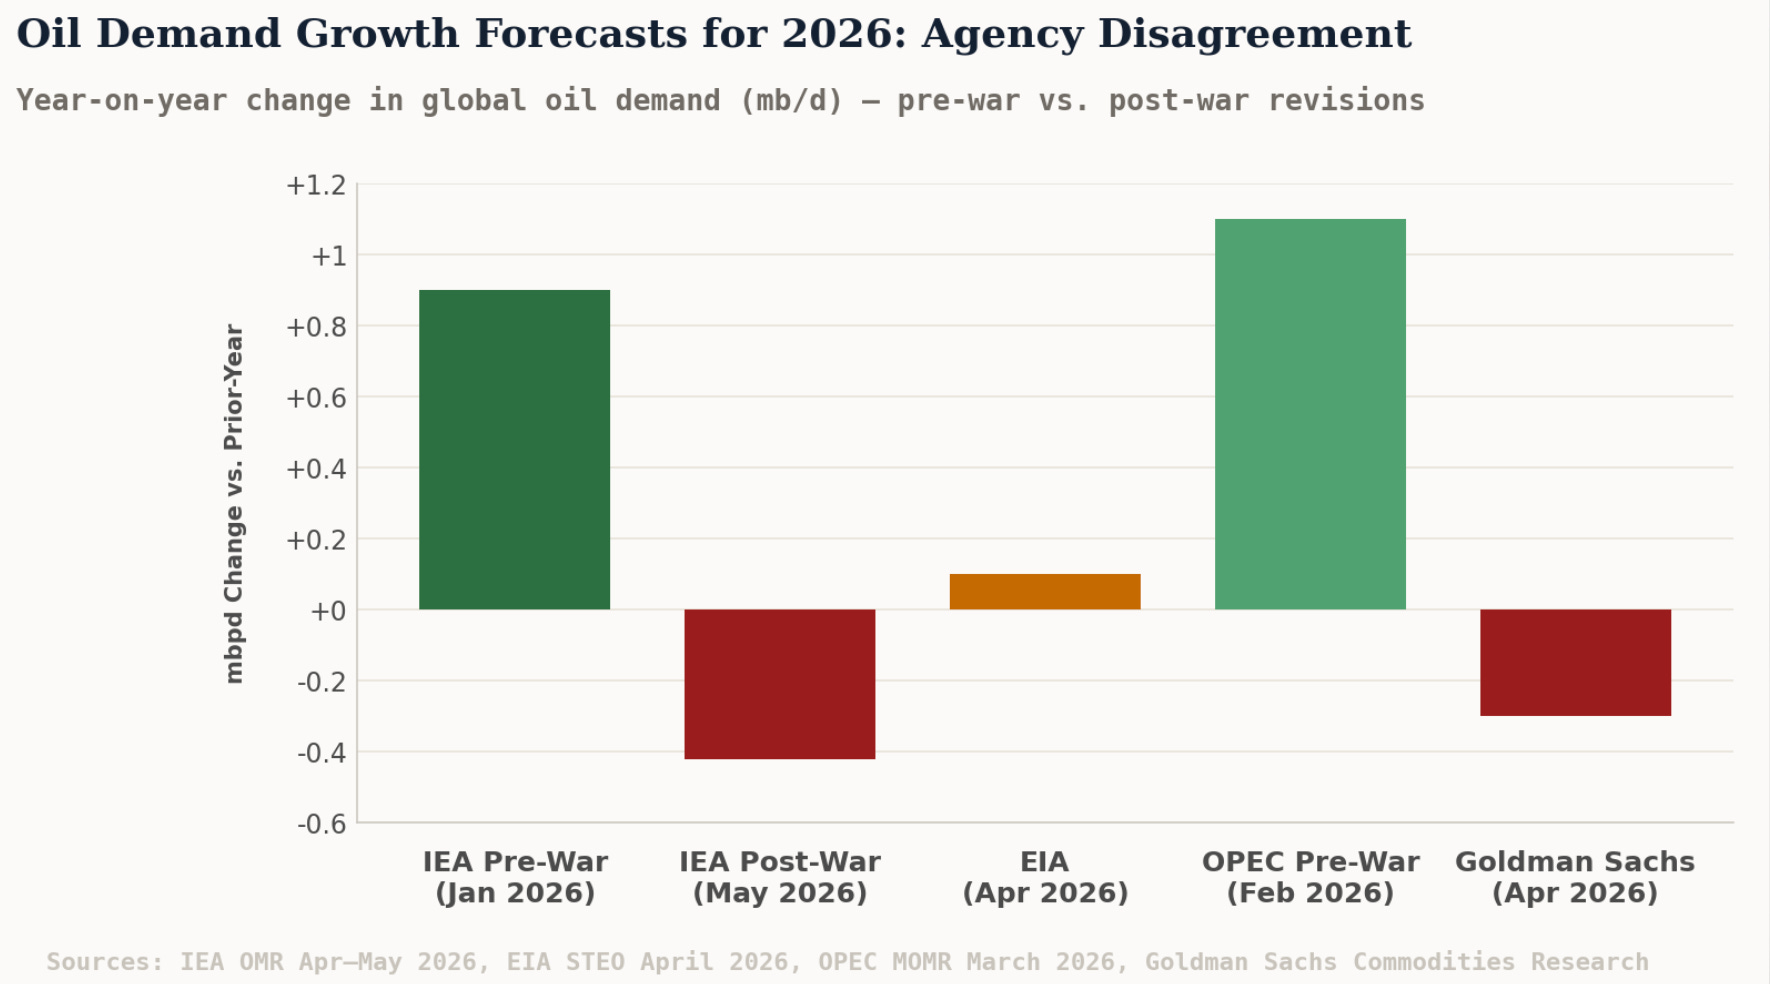
The demand side of the 2026 oil equation is being pulled in two opposing directions simultaneously, and the net result is a picture of unusual complexity. Soaring prices are destroying demand in ways both expected and unexpected, while some underlying demand pressures remain persistent. The IEA’s April assessment captured the contradiction precisely: global demand is forecast to contract by 420,000 barrels per day year-on-year in 2026 — but the deficit between supply and demand remains acute because supply has fallen far more than demand.
Price-driven demand destruction is the dominant near-term force. Brent above $100 per barrel functions as an aggressive tax on every economy that imports oil — which is to say, virtually every developed and emerging economy on earth. The IEA notes that the pass-through to retail fuel prices is already well advanced in OECD countries, where the market mechanisms that translate crude price changes into pump prices operate with relative efficiency. Petrochemical feedstock demand — naphtha and LPG — has been cut sharply. Aviation has been hit particularly hard: jet fuel prices more than doubled after the war began, and some carriers have grounded or rerouted flights to manage costs. The deepest cuts in oil use have come in the Middle East itself and across Asia Pacific.
China’s situation exemplifies the demand-destruction dynamic. Imports fell 20 percent in April year-on-year. Beijing has been drawing on its massive 1.39 billion barrel strategic reserve — equivalent to 120 days of net imports at 2025 levels — rather than paying spot prices above $100. Chinese producer prices jumped 2.8 percent year-on-year in April, the fastest pace since 2022, as energy cost inflation works through industrial supply chains. China is 85 percent energy self-sufficient in aggregate, and its aggressive build-out of domestic renewables and its EV penetration (approximately 40 percent of new vehicle sales domestically) provide structural insulation that is materially greater than in 2008 or 2012. But the scale of its seaborne oil dependency — 38 percent of all Hormuz-transiting oil was China-bound — means that no amount of structural resilience eliminates the exposure.
The diesel and distillate market is the most acute product-level concern. Diesel is the fuel of global commerce: it powers freight trucks, container ships, agricultural machinery, construction equipment, and industrial generators. The manufacturing slowdown that elevated oil prices inevitably produce hits diesel demand hardest. But the supply disruption has hit diesel production even harder, as Asian refineries processing lighter crude grades — the only alternative feedstocks accessible in a Hormuz-closed world — produce less middle distillate relative to gasoline and naphtha. Asia’s refining throughput is expected to tumble in April and May, cutting diesel and jet fuel output by at least a million barrels per day. The resulting premium for middle distillates has been extraordinary: diesel and jet fuel benchmark prices more than doubled in the weeks following the war’s onset.
Europe faces a compound crisis that layers the oil demand shock onto a pre-existing natural gas vulnerability. The continent emerged from the harsh 2025–26 winter with gas storage at approximately 30 percent of capacity — estimated at just 46 billion cubic metres, compared to 60 bcm at the same point in 2025 and 77 bcm in 2024. The closure of the Strait of Hormuz stranded Qatar’s LNG exports — the single largest source of European LNG imports — almost immediately upon war’s outbreak. Iran’s March 18 strike on the Ras Laffan LNG complex has created damage requiring three to five years to fully repair, making the disruption to Qatari LNG supply structurally persistent rather than merely temporary. Dutch TTF natural gas prices nearly doubled to over €60 per megawatt-hour by mid-March. Europe will need to inject approximately 60 billion cubic metres of gas during the refill season just to meet its 90 percent storage target by autumn — and it will need to do so in a market where the world’s primary LNG exporter is partially offline.
What makes the demand picture intellectually uncomfortable is precisely the uncertainty it creates. Demand destruction is nominally good for balancing the market — it reduces the consumption deficit — but demand destruction of this magnitude signals economic recession. Lower oil demand that reflects falling industrial output, contracting freight volumes, and consumer retrenchment is not a healthy rebalancing mechanism; it is an early warning of broad economic contraction with cascading second-order effects on government revenues, employment, and the very fiscal capacity needed to fund energy transition programmes. The oil price, in this perverse situation, is simultaneously too high to sustain growth and not high enough to quickly restore the supply volumes the market has lost.
Section 08
