

A complete review of Q2 earnings, sector leadership, profit quality, corporate guidance and the expectations embedded in share prices.
This document is LongYield’s independent research and is provided for informational purposes only. It is not investment advice, nor an offer or solicitation to buy or sell any security. Figures are sourced from FactSet as dated; forward estimates are consensus expectations and are subject to revision. LongYield is not a licensed investment adviser. Readers should conduct their own analysis and consult a qualified professional before making investment decisions.

A boom that ranks with the pandemic rebound, and how it got there
The second quarter of 2026 delivered the strongest earnings growth the S&P 500 has posted in five years. On a blended basis, combining companies that have reported with estimates for the small remainder, index earnings grew 52.0% year over year. The last time the benchmark grew faster was Q2 2021, when the economy was lapping the depths of the pandemic and the comparison flattered every number.
This is the second consecutive quarter of growth above 25%, and the seventh straight quarter of double-digit expansion. Revenue kept pace in a way it did not during earlier profit spurts: the top line grew 15.5%, the fastest since the 16.1% of Q4 2021. A growth rate of that size, sitting on top of real revenue acceleration, is not the signature of a cost-cutting cycle. Something in the demand environment, or in a handful of very large companies, is doing genuine work.
The number also built as the season progressed. At the August 7 mid-season checkpoint the blend stood at 50.4%; by the near-final tally on August 28, with roughly 97% of companies in, it had climbed to 52.0%. Upside accumulated rather than faded, which is the opposite of the usual pattern where early reporters set a high bar that laggards drag back down.
Fifty-two percent is a genuine number. Whether it is a repeatable one is the question this review is built to answer.
Our task from here is to separate the durable from the distorted. A growth rate that large invites a simple question: is it broad-based strength, or is it the accounting of two enormous companies dressed up as an index-wide event? Both, as it turns out, and the proportions matter more than the headline.
The margin told the truth the headline could not
Start with the cleanest fact of the season. The S&P 500’s net profit margin in Q2 2026 was 17.0%, a record in the series that runs back to 2009. This is not “near a record” and it is not a rounding story: the prior peak, set the quarter before in Q1 2026, was 14.8%. A jump of more than two full percentage points in a single quarter, to an all-time high, is the strongest single piece of evidence that the quarter’s strength was real.
Profitability of that order does not come from a low base or from beating a depressed estimate. It comes from companies keeping more of every dollar of a fast-growing revenue line. That is the anchor for everything that follows.
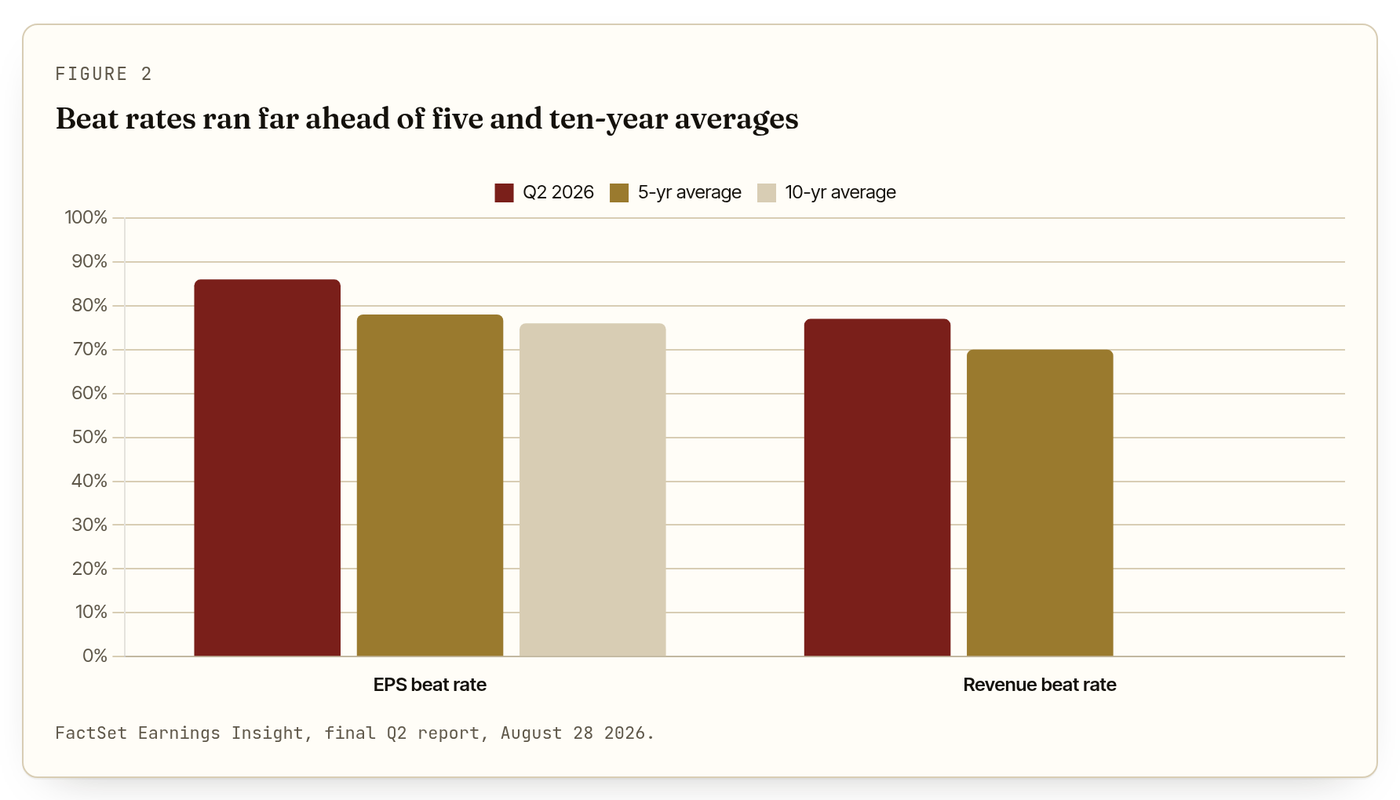
The breadth of the beats reinforces it. 86% of companies reported earnings above analyst estimates, against a five-year average of 78% and a ten-year average of 76%, the highest share since Q2 2021. On the top line, 77% beat revenue estimates versus a five-year average of 70%. Companies were not clearing a single hurdle; they were clearing both, at rates well above their own history.
The surprise magnitude is where caution has to enter. The aggregate earnings surprise came in at a record +26.5%, the highest since FactSet began tracking the figure in 2008. It had peaked even higher, at +29.2%, earlier in the season before settling. A number that extreme should make any analyst suspicious, because it is not what a normal quarter of operating strength produces.
The suspicion is warranted, and it has a name. Two companies account for a large share of both the growth and the surprise. Excluding Alphabet and Amazon, the blended earnings growth rate falls from 52.0% to 33.8%. Excluding Alphabet alone it is 40.6%; excluding Amazon alone, 45.9%. The aggregate surprise, stripped of the same two names, drops from +26.5% to roughly 10.8%, which is a strong but recognizably normal figure.
Where the distortion comes from
The mechanism is not operating profit. Alphabet reported EPS of $9.11 against a $2.88 estimate, a result driven by roughly $98 billion of other income, chiefly net unrealized gains on equity securities it holds. Amazon reported EPS of $5.75 against a $1.82 estimate, on roughly $53.4 billion of other income, largely the mark-to-market on its stake in Anthropic. These are real gains under the accounting rules, and they flow through reported net income, but they are not the recurring, operational earnings that a forward multiple is supposed to capitalize.
By our own arithmetic, those two gains sum to approximately $151 billion. We flag that figure clearly as LongYield’s aggregation of the two companies’ disclosed other-income lines, not a margin adjustment that FactSet has published. It is a useful way to size the distortion, and nothing more.
Here is the reassuring part, and the reason the margin leads this section rather than the surprise. FactSet’s own de-distortion, removing Alphabet and Amazon entirely, lowers the index net margin only to roughly 15.0% to 15.1%. That is still a record. The profit quality of the other 498 companies did not depend on the two mega-cap gains. The gains inflated the growth rate and the surprise; they did not manufacture the record profitability.
Strip out the two names that flattered the growth rate, and the margin is still an all-time high. The boom is narrower than 52% implies, but it is not hollow.
Ten of eleven sectors grew, but the leaderboard is a mega-cap story
Growth was broad in the sense that ten of the eleven sectors expanded earnings, and nine of those ten grew at double-digit rates. Health Care was the sole decliner, at roughly -6.5%. That is a healthy distribution. But the top of the leaderboard is dominated by sectors that happen to house the two companies discussed above.
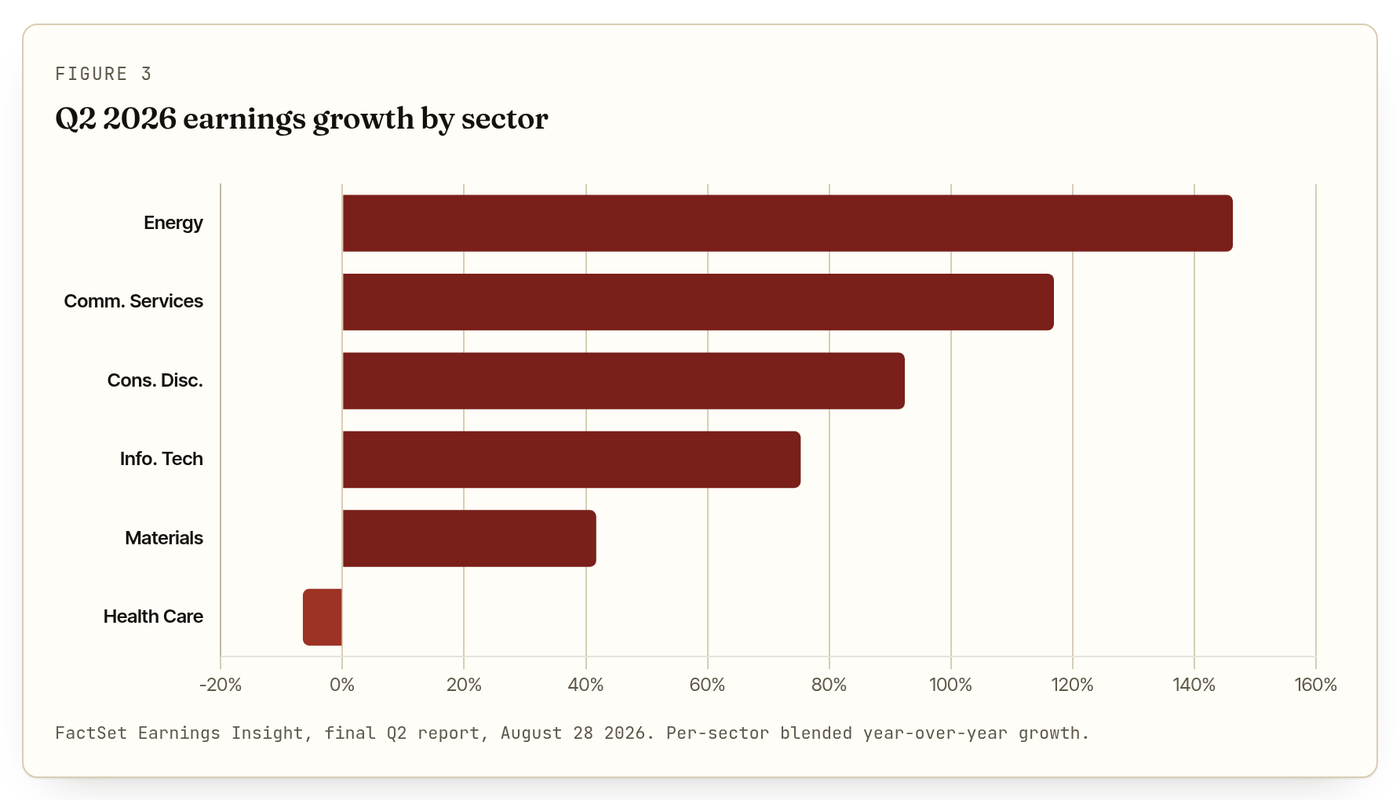
Energy led at roughly +146.3%, a sector-specific rebound off weak year-ago comparisons. Communication Services followed at +116.9% and Consumer Discretionary at +92.4%. Information Technology grew +75.3% and Materials +41.7%. The distribution looks like a wide boom until you note where Alphabet and Amazon sit.
Alphabet is classified in Communication Services and Amazon in Consumer Discretionary. Those two sectors lead the non-Energy field largely because of the two companies inside them. Excluding Alphabet, Communication Services growth drops sharply; excluding Amazon, Consumer Discretionary growth drops sharply. The sector picture is genuine, but the two highest non-Energy bars are carrying passengers.
The concentration question
FactSet’s Magnificent 7 grouping makes the concentration explicit. Those seven companies grew earnings 118.5% in aggregate, the strongest since at least Q4 2020. Remove Alphabet and Amazon from even that elite group and the remaining five grew 43.2%, still excellent but a different order of magnitude.
The more important number for anyone worried about narrowness is the other 493. Those companies, the index minus the Magnificent 7, grew earnings 31.8%, the fastest since the 32.4% of Q4 2021. This is the figure that should calm the concentration anxiety. The market’s earnings engine was not seven stocks; the broad middle of the index grew at better than 30%.
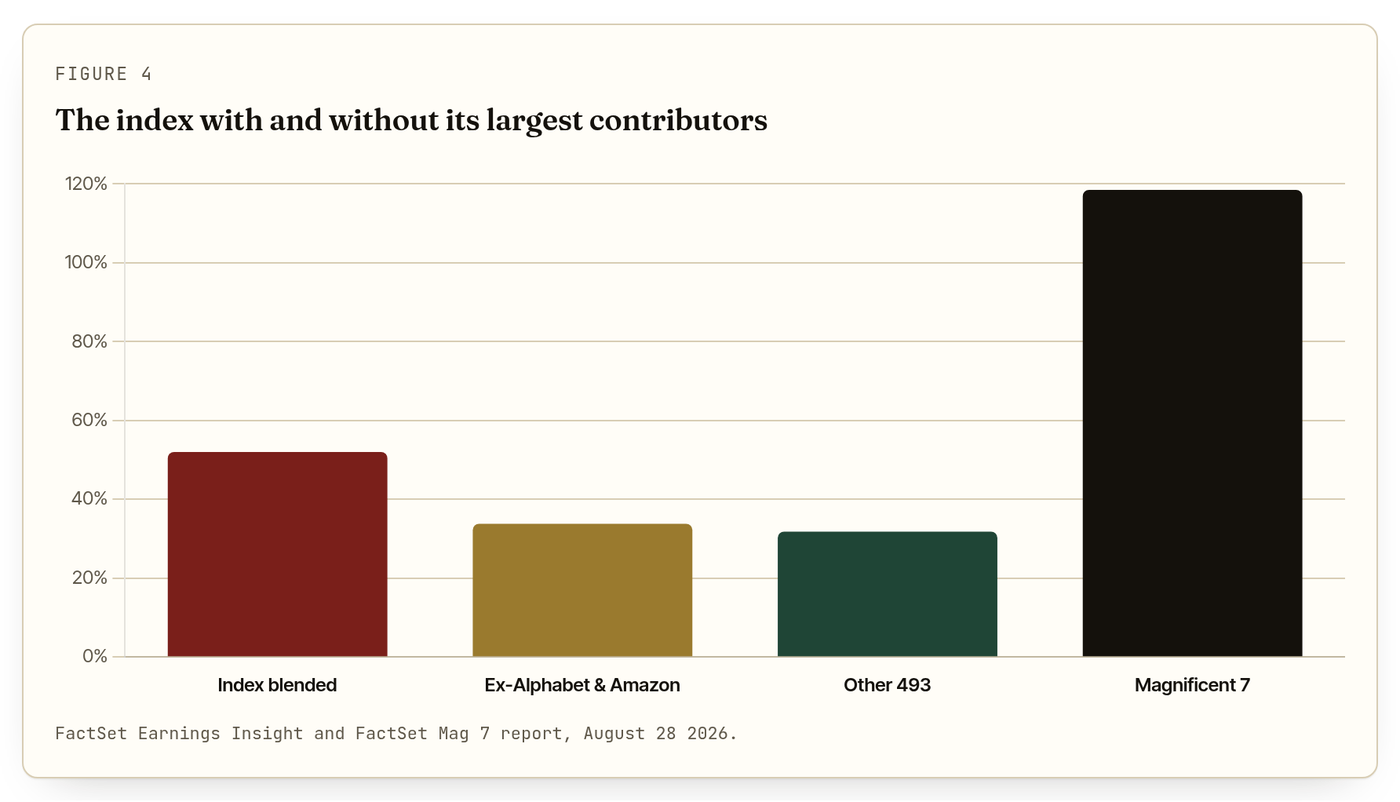
The other 493 companies grew earnings almost 32%. Concentration explains the extremes of the leaderboard, not the health beneath it.
