
The Trillion-Dollar Power Bottleneck
AI's Next Constraint Isn't Silicon. It's Megawatts.


For the past three years, every constraint conversation in technology centered on silicon. GPU allocations. TSMC wafer starts. High-bandwidth memory stacks. The semiconductor supply chain was the choke point, and anyone who could procure H100s — or their successors — held the keys to the AI kingdom. That constraint was real. But it was also, in the end, solvable. Nvidia scaled manufacturing. TSMC signed multi-year capacity commitments with every major hyperscaler. Advanced Micro Devices finally muscled into the data center with credible competition. First-generation AI hardware scarcity has given way to a more normalized, capital-intensive but navigable supply chain.
Power is a fundamentally different kind of problem. You cannot simply capitalize your way out of a 4,000-megawatt transmission constraint in 18 months. You cannot fast-track a nuclear plant through a decade of regulatory review by hiring more lawyers. You cannot run data center cooling systems on optimism or quarterly guidance. The electrical grid — the infrastructure of moving electrons from generation source to server rack — is the product of a century of incremental construction, engineering compromise, political negotiation, and physical reality. And that grid is now being asked to absorb a demand impulse unlike anything it has faced since the post-war electrification of American industry.
This Field Note examines the power bottleneck as a structural investment thesis: what is the actual scale of the problem, why capital alone cannot fix it on the timelines the market is assuming, which generation technologies will realistically meet the demand and over what horizons, and — most importantly for long-horizon investors — which companies are positioned to capture the economics of this constraint, not just benefit from its eventual resolution. The core argument, in brief: the companies solving the electrical infrastructure problem for AI are among the most overlooked and durable infrastructure plays of this decade, and the market has only recently begun to price the thesis correctly.
§01 — The Scale of the Problem
A Demand Shock the Grid Was Never Designed For
To understand why the power bottleneck matters, you first need to calibrate the demand numbers precisely. The public confusion in this area often stems from a units problem: kilowatts, megawatts, and gigawatts are routinely conflated in tech media, and the scale difference between them is not merely semantic — it is the difference between a household appliance and a regional power plant. A kilowatt (kW) is roughly what a hair dryer draws. A megawatt (MW) is a thousand kilowatts — enough to continuously power 600 to 900 homes depending on regional demand profiles. A gigawatt (GW) is a thousand megawatts, roughly the output of a large conventional nuclear or gas-fired power plant. The United States currently has approximately 1,100 GW of total installed generating capacity across all sources.
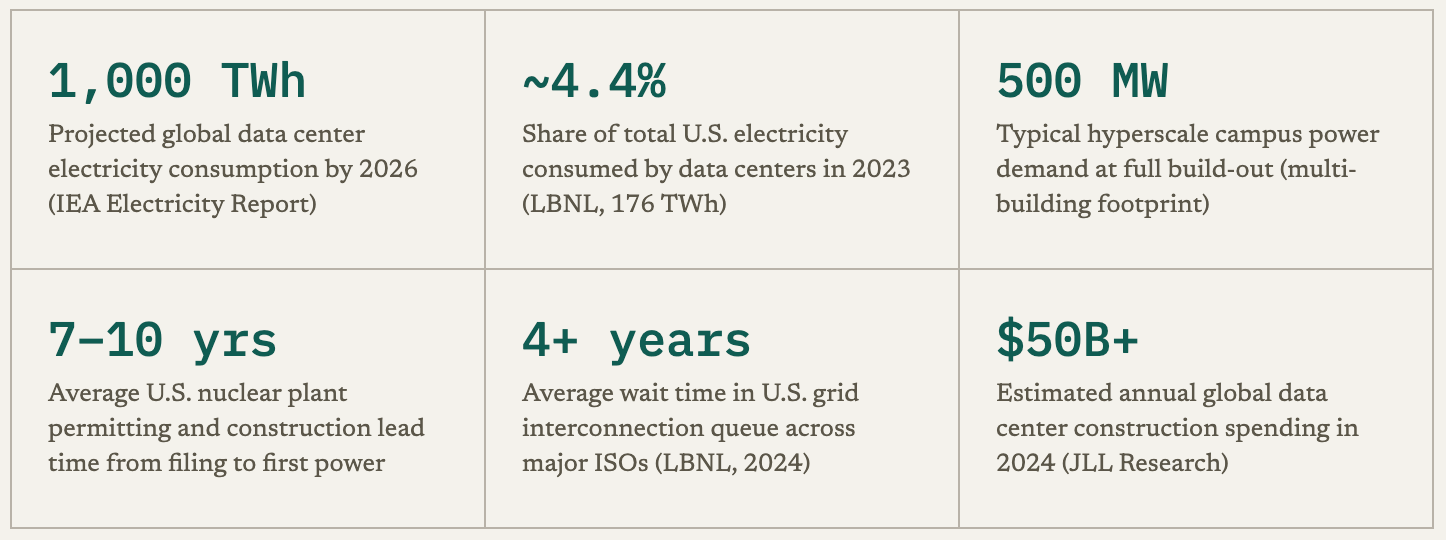
With that calibration in mind, consider what the hyperscalers are currently building. A single large-scale AI data center campus — the kind that Microsoft, Google, Amazon, and Meta are now deploying across Northern Virginia, Phoenix, Iowa, and North Texas — consumes in the range of 300–500 MW at full build-out. That is not the power draw of a building. That is the power draw of a small American city. Microsoft committed more than $80 billion in data center capital expenditure for fiscal year 2025 alone. Google announced $75 billion for calendar 2025. Amazon Web Services spent more than $131 billion in capital expenditure in 2025, the vast majority directed at cloud and AI infrastructure. These are not aspirational figures — they are contracted construction pipelines with shovels already in the ground, and they translate directly and mechanically into megawatt demand.
The compute driver is not subtle. A single Nvidia H100 GPU draws approximately 700 watts under sustained training load. The H200 runs at 700 watts (matching the H100’s TDP). The Blackwell B200, now the standard building block of frontier model training, draws 1,000 watts or more per device under continuous operation. A cluster configured with 16,000 H100 GPUs — a now-common building block for foundation model training — consumes approximately 11 megawatts continuously on the IT load alone. Add cooling overhead — typically 30–50% of IT load for conventionally cooled configurations (PUE 1.3–1.5), though dense GPU air-cooling approaches 40–60% overhead while modern liquid cooling systems achieve 10–20%, managed through computer room air handlers, chilled water loops, and increasingly through direct liquid cooling — and a 16K-GPU building draws 15–18 MW before you count networking, lighting, security, or facilities systems. When Microsoft talks about a “500 MW campus,” they mean multiple buildings like this, operating simultaneously, drawing power around the clock, 365 days a year.
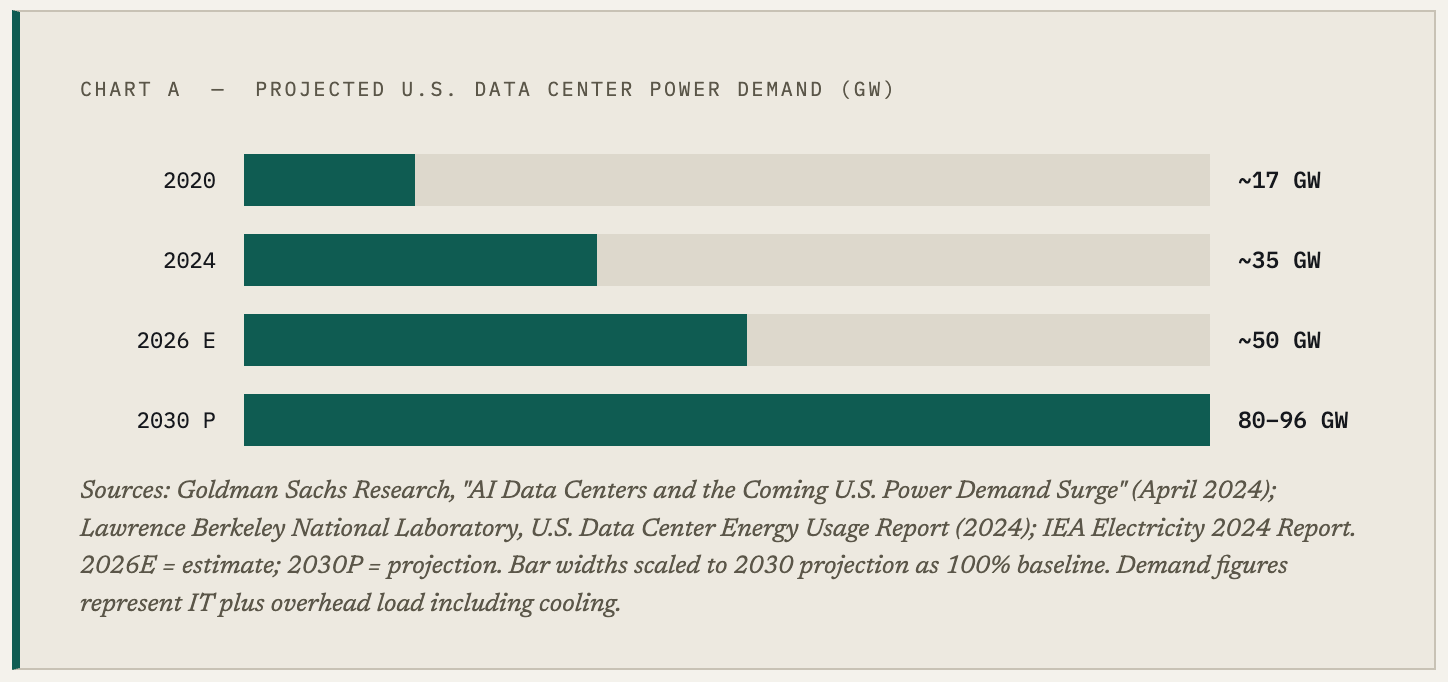
The International Energy Agency, in its 2024 Electricity Report, projected that global data center electricity consumption would reach approximately 1,000 terawatt-hours (TWh) by 2026 — roughly double the 2022 figure, and equivalent to the total annual electricity consumption of Japan. In the United States specifically, Lawrence Berkeley National Laboratory estimated domestic data center consumption at approximately 176 TWh in 2023, representing approximately 4.4% of total U.S. electricity generation. Goldman Sachs Research and the Electric Power Research Institute, in widely-cited 2024 reports on AI data center demand, projected that U.S. data center power demand could grow from roughly 35 GW in 2024 to approximately 80–96 GW by 2030 — a near doubling over six years, requiring some $50 billion in new utility investment and 47+ GW of incremental generation capacity. The Electric Power Research Institute (EPRI) has similarly modeled U.S. electricity demand growing by 15–20% between 2024 and 2030 once data centers, EV charging, heat pump electrification, and industrial reshoring are layered together.
One useful historical comparison: the entire U.S. steel industry at the height of post-war industrialization in the 1950s consumed approximately 50–60 TWh of electricity annually. The Manhattan Project consumed roughly 1.5 TWh over its peak three-year period. The Tennessee Valley Authority — the signature infrastructure program of the New Deal — was designed to deliver roughly 10 GW of generating capacity to the Southeast over several decades. The AI data center build-out is now projected to require roughly the equivalent of a new TVA every 24 months, built not in the remote valleys of Appalachia with federal land authority and Depression-era labor economics, but in the most developed, contested, and regulated power markets in the world. The analogy is not intended to be hyperbolic — it is intended to convey why the timeline constraints described in §02 are real and non-negotiable.
To put the 2030 projection in sharp relief: 96 GW of data center demand would represent roughly 8.7% of current U.S. total generating capacity — consumed by a single end-use category that barely appeared in utility integrated resource plans a decade ago. That 8.7% figure also assumes no other demand growth in the intervening years, which is deeply unrealistic. The grid was designed for a world in which total U.S. electricity demand grew at 0.5–1.0% per year, driven by incremental residential and commercial consumption. The compound demand event now underway — AI data centers plus EV charging plus heat pump adoption plus semiconductor fab construction (Intel’s Ohio fab, TSMC’s Arizona facility, Samsung’s Texas plant) — represents a regime change in load growth, not a deviation from trend.
“The grid was designed for a world where electricity demand grew at one percent per year. AI data centers are now responsible for an estimated 30–40% of net new U.S. annual demand growth, concentrated in a handful of ZIP codes.”
LongYield Analysis, June 2026
§02 — Why Hyperscalers Can’t Scale Infinitely
The Last Mile Problem for Electrons
Capital is not the binding constraint on data center power delivery. This is the insight that the market has been structurally slow to price. Microsoft, Google, Amazon, and Meta have virtually unlimited capital relative to the cost of electrical infrastructure. The combined 2025 capex cycle for the four largest hyperscalers exceeded $350 billion. The constraint is not financial — it is physical, procedural, regulatory, and temporal. You cannot order power from a catalog, and the processes that govern its delivery were designed for a world that did not anticipate this demand profile.
The Grid Interconnection Queue
The foundational bottleneck is the interconnection queue — the formal process by which any new electrical load or generation source applies to connect to the bulk power transmission system. This process is administered by Regional Transmission Organizations (RTOs) and Independent System Operators (ISOs): entities that manage the grid across multi-state footprints. PJM Interconnection covers 13 Mid-Atlantic and Midwestern states including Virginia — the world’s largest data center market. MISO covers the Midwest. ERCOT operates Texas as an islanded grid. CAISO manages California. Every significant data center campus, and every power plant that wants to serve one, must clear the interconnection queue of the relevant ISO.
As of late 2024, over 2,600 GW of generation and storage projects were sitting in U.S. interconnection queues, awaiting approval — a figure that exceeds current total installed U.S. generating capacity by a factor of 2.4. Average wait times across the major ISOs exceeded four years, per Lawrence Berkeley National Laboratory’s 2024 “Queued Up” report. The PJM queue alone had backlogs exceeding five to six years for large projects. Understanding why this process takes so long requires walking through the actual procedural steps, because each one has genuine engineering logic:
The Interconnection Queue Process — Why 4+ Years Is Realistic
Step 1 — Application & Queue Position Assignment (3–6 months): The applicant files a detailed interconnection request, pays a deposit (typically $50,000–$500,000 depending on project size), and receives a queue position. The queue is first-come, first-served, and projects ahead of you define what transmission upgrades you may need to pay for. Step 2 — Feasibility Study (6–12 months): The ISO models whether the proposed interconnection is physically plausible given existing grid conditions. If not feasible, the application is returned. Step 3 — System Impact Study (12–18 months): Engineers model the effect of the new load or generation on voltage stability, thermal limits, frequency response, and short-circuit levels across the affected transmission area. This is computationally intensive and must account for every other project in the queue ahead of the applicant. Step 4 — Re-studies (variable): When projects ahead in the queue are modified or withdrawn — which is extremely common; withdrawal rates in PJM have exceeded 70% of queue entrants in some years — the ISO must re-run the system impact study for projects further back in the queue, because the transmission upgrade obligations change. Re-studies can add 12–24 months of additional delay. Step 5 — Facilities Study (12 months): Detailed engineering design of required transmission upgrades: new lines, substation expansions, transformer additions, protection system modifications. Step 6 — Interconnection Agreement Execution (6 months): Legal negotiation and execution of the binding interconnection agreement, including cost allocation for required upgrades. Step 7 — Physical Construction of Required Upgrades (2–5 years): The transmission upgrades identified in the facilities study must actually be built before the new interconnection can operate at full capacity. This requires permitting, right-of-way acquisition, equipment procurement (with 18–36 month lead times on large transformers), and construction. Total realistic timeline for a 300 MW data center load: 4–7 years from application to full power availability.
FERC issued Order 2023 in July 2023, which attempted to reform the interconnection process by moving from sequential individual project studies to clustered, parallel “study groups.” The intent was to reduce cascading delays from withdrawals by studying similarly-timed projects simultaneously. The reforms are substantive and represent the most significant overhaul of interconnection procedures in 20 years. But implementation is uneven across ISOs, contested by incumbent utilities in regulatory filings, and does not eliminate the fundamental physical engineering requirement of modeling transmission system impacts. The backlog built up under the old system does not dissolve overnight.
Utility Approval Timelines and the Regulatory Compact
Beyond ISO interconnection, a data center must also negotiate with the local distribution utility for a service delivery agreement. Investor-owned utilities — Dominion Energy, Duke Energy, Georgia Power, APS, and their peers — operate under a regulatory compact: they receive a geographic monopoly on electricity distribution in exchange for an obligation to serve all customers in their territory at rates approved by state public utility commissions (PUCs). Adding a 300 MW industrial load is not as simple as signing a commercial lease. It typically requires a rate case or large industrial service proceeding at the state PUC level.
Virginia is instructive. Loudoun County in Northern Virginia hosts the highest concentration of data center capacity anywhere on earth, representing roughly 70% of global internet traffic routing through its substations on any given day. Dominion Energy Virginia has filed multiple rate cases explicitly citing data center load growth as a driver of distribution and transmission upgrade costs. The State Corporation Commission has scrutinized how those infrastructure investment costs should be allocated between large industrial customers (the data centers) and residential ratepayers — a political question as much as a regulatory one. Rate cases in Virginia take 12–18 months to complete. Other states are similar or slower.
It is worth pausing on the economics of the interconnection queue problem for data center operators. Unlike generation projects, which can locate themselves near existing transmission capacity, data centers have more constrained siting options — they need fiber connectivity, road access, proximity to labor markets, and favorable tax jurisdictions in addition to power. This means that the most desirable data center sites tend to be in areas where the grid is already highly stressed: Northern Virginia, where the existing substation network was built to serve a suburban residential and commercial load — not 70% of global internet traffic. Phoenix, where summer cooling load already taxes Arizona’s transmission corridors. The data center industry’s geography is not an accident — it was determined by where fiber networks were laid in the 1990s and early 2000s, creating path dependency that the grid must now serve regardless of whether it was designed for the task. The most valuable data center real estate in the world is in the most congested grid corridors in the country, and moving the demand to where the power is plentiful is not a viable solution at the scale and speed required.
Water, Zoning, and Physical Equipment Constraints
Even with interconnection approval and a utility service agreement in hand, large-scale data centers face three additional physical constraints that compound sequentially. Water is the first: evaporative cooling towers at a 100 MW data center consume 1–3 million gallons per day, depending on local climate conditions and cooling design. Western states with prime solar resources — Arizona, Nevada, New Mexico — face water availability limits that constrain cooling options and, in some jurisdictions, restrict data center permitting outright. Dry-cooled and liquid-cooled alternatives exist but add 15–25% to facility construction costs.
Zoning is the second. Data centers generate persistent noise from cooling fans and chiller units, require large land footprints (often 20–100 acres for major campuses), consume disproportionate power relative to local employment, and produce tax revenue that flows disproportionately to county and state governments rather than local school districts. The initial welcome extended to data centers in Northern Virginia and other markets has curdled in some jurisdictions. Prince William County, Virginia — directly adjacent to the Loudoun data center corridor — enacted zoning restrictions in 2023 that effectively halted new data center development in portions of the county. Similar dynamics have played out in Amsterdam (which imposed a moratorium in 2019 that was only recently modified), Dublin, and Singapore.
The third constraint is physical equipment: power transformers. Large power transformers — the site-specific units that step down transmission-voltage electricity (115 kV, 230 kV, 500 kV) to the medium-voltage levels usable by data center electrical infrastructure — have lead times of 18–36 months from major manufacturers. These are bespoke, custom-engineered pieces of equipment manufactured primarily in South Korea (Hyundai, LS Electric), Germany (Siemens Energy, ABB), and Japan (Hitachi). U.S. domestic transformer manufacturing capacity covers only a fraction of domestic demand. When a data center project secures its site, utility agreement, and interconnection approval simultaneously — which itself is a multi-year achievement — it can still be delayed by 12–24 months waiting for transformer delivery. The equipment supply chain is the operational last mile.
“A transformer that used to quote 12 months now comes back at 28 months. You can have the site, the permits, the utility agreement, and the capital — and you still wait for the iron.”
Senior Infrastructure VP, Tier-1 Hyperscaler · Bloomberg, Q3 2024
§03 — The Generation Race
