

United Airlines Performance Recap: A Comprehensive Look
United Airlines Performance Recap: A Comprehensive Look
Detailed Examination of the Last Five Quarters' Earnings and Strategic Milestones

")
Stock Overview:
Market Data
52 Week High: $58.23
52 Week Low: $33.68
Avg. 3 Month Volume: 8.45 MM
5 Yr Beta: 1.51
Short Interest: 5.3%
Capital Structure
Market Cap (MM): $12,612.25
Enterprise Value (MM): $34,963.25
Shares Outstanding: 328.02 MM
LTM Net Debt (MM): $20,029.00
LTM Net Debt/EBITDA: 2.49x
Efficiency
LTM Gross Margin: 33.3%
LTM EBIT Margin: 9.6%
LTM ROA: 4.7%
LTM ROE: 32.3%
Growth
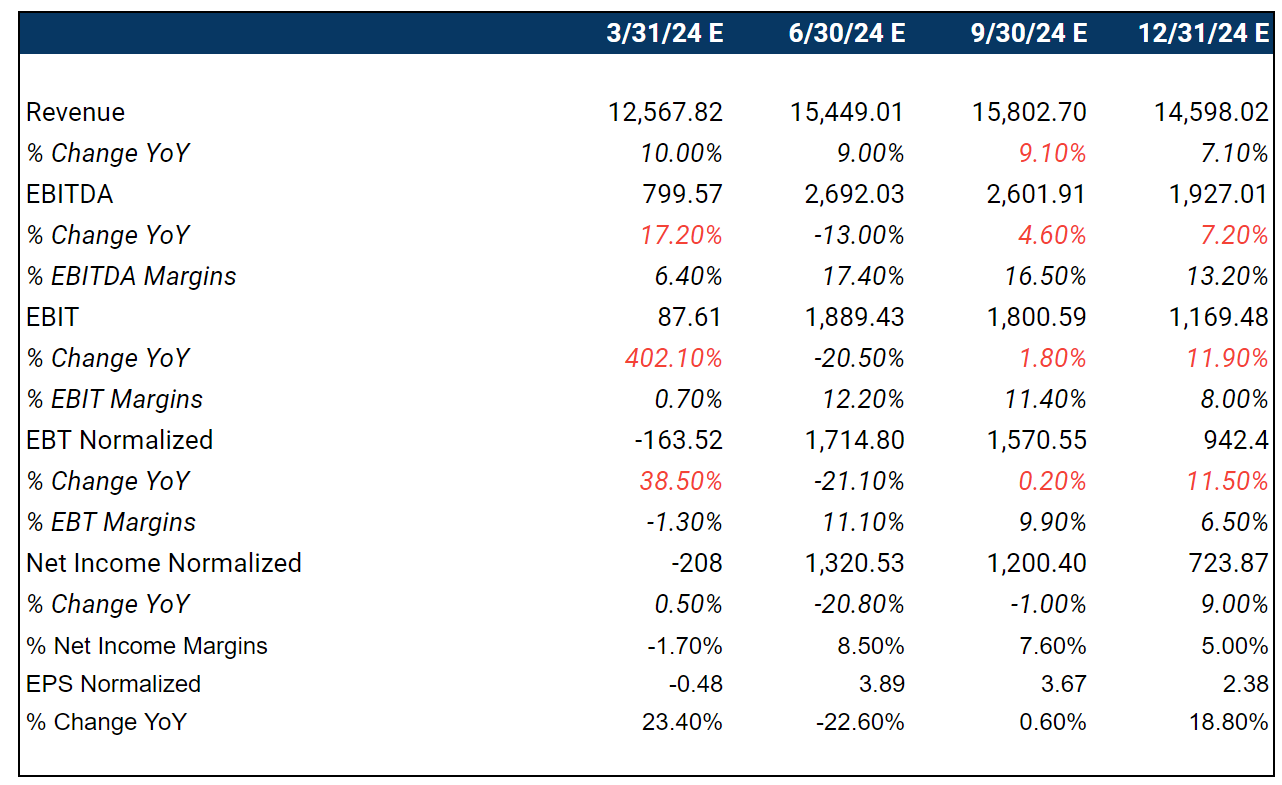
Fwd 2-Yr Rev. CAGR: 5.5%
Fwd 2-Yr EBITDA CAGR: 6.3%
Fwd 2-Yr EPS CAGR: 7.6%
Last 3-Yr Rev. CAGR: 51.8%
Next Quarters Estimates
Financial Performance:
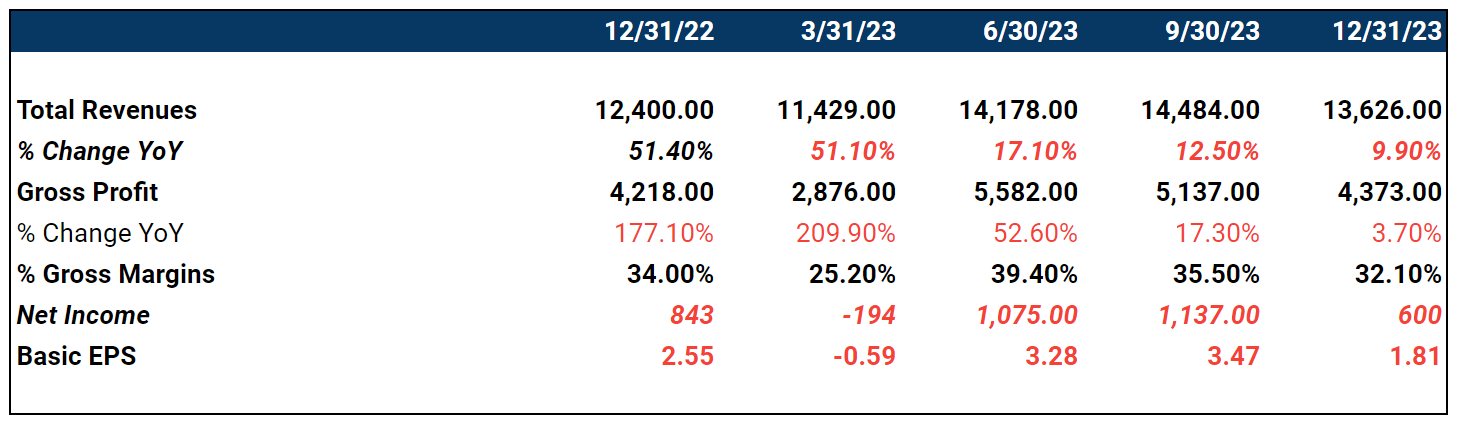
Q1 2023: Pre-tax loss of $256 million, revenue $11.4 billion (up 51% YoY), TRASM up 22.5% YoY, CASM-ex down 0.1% vs Q1 2022, focus on cost management.
Q2 2023: Record pretax earnings $2.2 billion, EPS $5.03, revenues $14.2 billion (up 17% YoY), international passenger revenue grew 44%, Pacific region showing remarkable resurgence.
Q3 2023: Pretax earnings $1.6 billion, pretax margin 10.8%, total revenue $14.5 billion (up 12.5% YoY), loyalty program significant revenue contributor.
Q4 2023: Pretax income $845 million, full-year EPS $10.05, TRASM increased 25.8%, PRASM by 24.6% compared to 2019, despite industry headwinds.
Operational Challenges and Responses:
Q1 2023: Low cancellation rates, focus on international expansion, operational excellence with lowest mainline flight and seat cancellation rates.
Q2 2023: Operational challenges at Newark; initiatives to improve operations, including reducing peak hour flights, increasing resources.
Keep reading with a 7-day free trial
Subscribe to LongYield to keep reading this post and get 7 days of free access to the full post archives.